
Measuring AI adoption rates is the essential signal linking investment to outcomes, policy insight, and risk oversight. Without it, you are flying blind on one of the most consequential technology bets your organization will make this decade. Here are the five reasons business leaders and researchers should track it:
- Policy and economic analysis: Adoption data lets the Federal Reserve and other agencies monitor AI’s macroeconomic diffusion and calibrate labor-market policy accordingly.
- ROI accountability: Seat counts and spend figures mean nothing without adoption data to anchor them to actual usage and output change.
- Risk and governance: Unmeasured AI use, including shadow AI, creates compliance exposure and data-leakage risk that only systematic tracking can surface.
- Workforce planning: Adoption patterns reveal which teams are building AI fluency and which are falling behind, informing training and hiring decisions.
- Research validity: The Federal Reserve Bank of St. Louis has shown that how you ask about AI adoption changes the answer dramatically, making measurement methodology a research-integrity issue, not just a dashboard preference.
Table of Contents
- Why measuring AI adoption rates matters for policy and economic research
- How “adoption” is defined and what metrics actually capture it
- How measurement method changes the result you see
- What empirical patterns tell you about adoption across firms and industries
- A step-by-step measurement plan you can implement in 60 days
- How Tekkr’s Configurato operationalizes AI adoption measurement
- What measurement choices imply for research, policy, and corporate strategy
- Why integrating multiple data sources is harder than it looks
- Ethical considerations and data privacy when collecting AI adoption data
- Key Takeaways
- The measurement gap nobody talks about
- Tekkr gives you the measurement infrastructure to act on this
- Useful sources for further reading
Why measuring AI adoption rates matters for policy and economic research
AI adoption measurement sits at the center of a much larger question: is AI actually changing how the economy works? Policymakers, economists, and firm leaders all need an answer, but they need it from data that is comparable across time, industries, and firm sizes. Without standardized measurement, diffusion research produces noise rather than signal.
The Federal Reserve’s FEDS Notes on monitoring AI adoption in the U.S. economy illustrates the stakes clearly. The Fed tracks AI adoption to assess productivity implications, labor-market shifts, and the pace of technology diffusion across sectors. When the underlying survey instruments change, the headline numbers change with them, and that creates a policy problem: you cannot compare 2024 adoption figures to 2026 figures if the question changed in between.
The Federal Reserve Bank of St. Louis ran what amounts to a natural experiment on this. When the Business Trends and Outlook Survey (BTOS) changed its AI question from asking whether firms used AI for “producing goods or services” to asking about “any of its business functions,” measured firm AI adoption nearly doubled—from about 7% in early 2025 to about 17% after the question update in November 2025 (source).
Stat to know: The BTOS measured production-focused firm AI use at 7% in early 2025. After the question update in November 2025, measured firm adoption rose to 17%. The same firms, a different question, a very different headline.
That gap is not a data error. It is a measurement design effect, and it is exactly why the importance of AI adoption metrics extends beyond corporate dashboards into the foundations of economic research.
How “adoption” is defined and what metrics actually capture it
“Adoption” is not one thing. Researchers and practitioners use the term to mean at least two distinct concepts, and conflating them produces scorecards that mislead rather than inform.

Extensive adoption asks who uses AI at all: the share of firms, workers, or functions that have touched an AI tool in a given period. It is a diffusion measure, useful for cross-sector comparisons and policy benchmarking.
Intensive adoption asks how deeply AI is embedded in work: frequency of use, share of tasks completed with AI assistance, prompt volume, or the degree to which AI functions as a production input rather than an occasional helper. This is where ROI lives.
The table below maps the most common metrics to the question each answers and its typical blind spot.
| Metric | Question it answers | Typical bias or blind spot |
|---|---|---|
| Adoption rate (% users) | Who has used AI at least once? | Counts one-time users the same as daily users |
| Active-user rate (weekly/monthly) | Who uses AI regularly? | Misses depth; a user who opens a tool daily may do nothing productive |
| Seat count | How many licenses are provisioned? | Measures procurement, not behavior |
| Prompt volume / token consumption | How much AI activity is happening? | Easy telemetry that is poorly correlated with business outcomes |
| AI-as-production-input share | How central is AI to actual output? | Hard to measure; requires process mapping |
| Proficiency score | Can employees use AI well? | Requires qualitative or structured assessment |
| Spend per outcome | What does each AI-driven result cost? | Requires tagged spend and outcome data simultaneously |
Leading practitioners and firms are shifting away from adoption-first metrics toward outcome and proficiency measures precisely because raw adoption counts can be misleading. A team with 100% seat utilization but no change in output quality has not adopted AI in any meaningful sense.
Pro Tip: When building your internal scorecard, anchor at least one KPI to a business outcome: time-to-close, error rate, throughput per employee. Seat counts and active-user rates belong in the scorecard as context, not as the headline.
How measurement method changes the result you see
The method you choose to measure adoption does not just affect precision. It changes the answer. That is the most important thing to understand before designing any measurement program.

Surveys are the most common approach at the firm and economy level. They are flexible and can capture both extensive and intensive adoption, but they are highly sensitive to question wording, response framing, and sample composition. The St. Louis Fed’s BTOS experiment is the clearest demonstration: a single wording change from “producing goods or services” to “any of its business functions” doubled the measured adoption rate from 7% to 17% (source). Surveys also suffer from social desirability bias, where respondents over-report AI use to appear current, and from recall error when asking about frequency.
Telemetry and usage logs solve the recall problem but introduce a different set of distortions. They capture only sanctioned tools on monitored infrastructure, which means shadow AI, the AI tools employees use without IT approval, is invisible. Prompt volume and token counts are easy to collect but create a measurement trap: organizations optimize for the metric they can see rather than the outcome they actually want. A team that generates ten thousand tokens a week may be producing nothing useful.
Administrative data (billing records, API call logs, procurement data) offers the most objective view of spend and access, but it requires tagging at provisioning. Retroactive attribution across multi-team cloud accounts is extremely difficult; labeling resources by team and product at provisioning is the only reliable path to cost-per-outcome metrics later.
Mixed approaches that combine a short survey with telemetry and a sample of outcome data give the most complete picture, but they require coordination across IT, finance, and HR that most organizations have not yet built.
Stat to note: The BTOS question redesign shifted the headline U.S. firm adoption figure from 7% to 17% with no change in actual firm behavior. Survey design is not a methodological footnote; it is a primary driver of the number you report.
Shadow AI deserves special attention. Blocking unauthorized tools before you have mapped usage patterns often drives covert workarounds, reducing your visibility rather than improving governance. Discovery first, governance second.
What empirical patterns tell you about adoption across firms and industries
When you look at adoption data across firms and industries, a few patterns hold up consistently enough to be useful benchmarks.
Larger firms and technology-intensive industries adopt faster. This is partly a resource effect (more budget, more IT capacity) and partly a task-composition effect (knowledge-intensive work has more AI-addressable tasks). Marketing, administrative, and customer-service functions tend to show higher adoption counts than production or operations functions, which partly explains why the BTOS production-focused question produced a lower rate than the broader business-functions question.
Common cross-cutting patterns researchers and leaders should expect:
- Function-level variation is large. Marketing and content teams often report 2–3x the adoption rate of finance or legal teams in the same organization, even with the same tool access.
- Firm-size gradients are steep. Enterprise firms with dedicated AI programs report materially higher adoption than small and mid-size firms, though intensive adoption (depth of use) does not always follow the same gradient.
- Geographic and framing effects compound. Cross-country comparisons are unreliable unless survey instruments are harmonized; the MIT Sloan research on AI adoption in America highlights how geography, industry mix, and question framing all interact.
- Self-reported adoption overstates actual use. When telemetry is available alongside survey data, the gap between reported and measured use is consistently positive, meaning people say they use AI more than logs confirm.
- Adoption rates are not static. They shift quickly with tool availability, training investment, and organizational incentives, which is why a single annual survey is rarely sufficient.
A well-designed data table that breaks adoption by function, firm size, and industry, populated from FRED or administrative sources, is the single most useful artifact a research team can produce for internal benchmarking.
A step-by-step measurement plan you can implement in 60 days
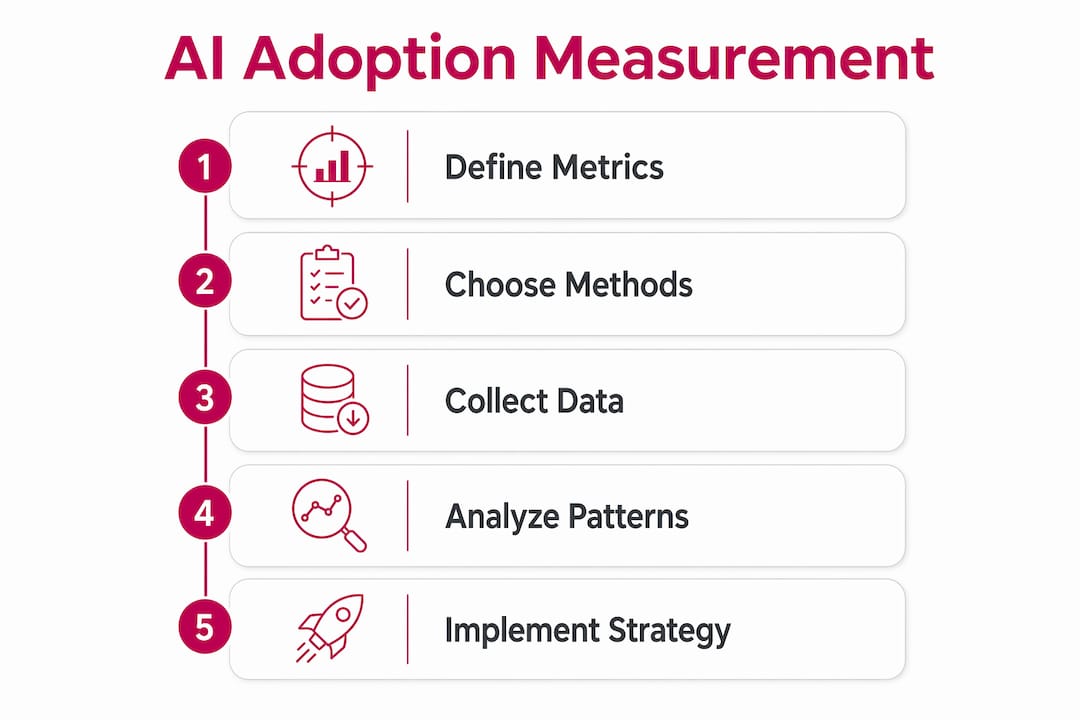
The measurement frameworks that work best layer technical performance, operational efficiency, business ROI, user adoption, and strategic alignment. Here is a practical sequence:
- Scope the measurement program. Define which tools, teams, and time window you are measuring. Narrow scope beats broad ambiguity.
- Establish a pre-deployment baseline. Without a baseline, post-hoc attribution of AI-driven change is unreliable and commonly overstated. Capture output quality, throughput, and error rates before go-live.
- Tag spend at provisioning. Label every AI resource by team and product from day one. Retroactive attribution is nearly impossible at scale.
- Instrument sanctioned tools. Enable usage logging for all approved AI tools. Separately, run a shadow AI discovery pass using behavioral fingerprinting or browser-extension discovery before applying governance.
- Design a short pulse survey. Four to six questions, run monthly for the first quarter. Disclose question wording in any report you publish.
- Select a small outcome signal set. Pick two or three measurable outputs that AI is supposed to improve: draft-to-publish time, ticket resolution rate, code review cycle time. These are your north-star metrics.
- Report on a 4–12 week cadence depending on how quickly your tools and teams change. Quarterly is the minimum for stable baselines; monthly is better during active rollouts.
| KPI | Why it matters | How to measure | Cadence |
|---|---|---|---|
| Active-user rate (weekly) | Distinguishes regular users from one-time experimenters | Usage logs from sanctioned tools | Weekly |
| Proficiency score | Tracks whether employees can use AI effectively | Structured assessment or manager rating | Quarterly |
| AI spend per outcome unit | Connects cost to value | Tagged spend + outcome data | Monthly |
| Shadow AI prevalence | Surfaces governance risk | Discovery scan + survey | Monthly |
| Outcome metric (task-specific) | Proves business impact | Process data (time, quality, volume) | Weekly or per-sprint |
Pro Tip: Correlate usage telemetry with your outcome signals every four weeks. If active-user rates climb but outcome metrics stay flat, you have an engagement problem, not an adoption success. That correlation is the most useful diagnostic you can run.
For rollout gating, require a minimum four-week baseline window before claiming AI-driven improvement. For seasonal businesses, extend that to twelve weeks to avoid confounding seasonal effects with AI effects.
How Tekkr’s Configurato operationalizes AI adoption measurement
Tekkr’s Configurato platform is built around the measurement gap most organizations hit: they can see seat counts but not outcomes, and they can see spend but not which team drove it. Configurato addresses both.
Core capabilities that support a rigorous measurement program:
- Cross-team spend tagging: Breaks down AI costs by team and tool in near real time, so finance can see cost-per-outcome rather than a single cloud bill.
- Usage aggregation across tools: Tracks who is actually using Claude, Codex, and other sanctioned tools, not just who has a license.
- Outcome linkage layer: Surfaces use-case intelligence that connects AI activity to business outputs, moving the dashboard beyond vanity telemetry.
- Gamified rollouts and AI playbooks: Drives adoption higher after measurement reveals which teams are lagging, so the platform closes the loop between measurement and enablement.
Consider a practical scenario: a technology firm uses Configurato to run its baseline measurement and discovers that its engineering team accounts for 60% of AI spend but only 30% of measurable output improvement, while the content team shows the inverse pattern. That finding directly informs a budget reallocation and a targeted training investment for engineering. Without tagged spend and outcome data in the same dashboard, that decision would have been a guess.
Pro Tip: Tekkr’s privacy-first architecture strips PII from prompts automatically and requires no browser extensions, which removes two of the most common objections IT and legal raise when you propose usage monitoring. That makes the governance conversation much shorter.
Security specifics: end-to-end encryption, GDPR compliance, automatic PII stripping, no browser-extension requirement. Setup takes roughly 10 minutes, with a free tier and no credit card required. For leaders who want to track AI adoption strategies at the enterprise level, Configurato provides the instrumentation layer that most internal BI tools cannot.
What measurement choices imply for research, policy, and corporate strategy
The choices you make about how to measure AI adoption ripple outward. For statistical agencies and survey designers, the St. Louis Fed’s BTOS experience is a direct call to action: standardize definitions, publish question wording alongside headline figures, and run methodological supplements when instruments change. Cross-country comparisons are only valid when the instruments are harmonized, and right now they largely are not.
For researchers, transparency on question wording, sample frame, and the distinction between extensive and intensive adoption should be table stakes in any published study. Sharing microdata where permitted accelerates the field’s ability to identify what is signal and what is measurement artifact.
For corporate strategy, the implications are more immediate. Measurement choices determine what gets optimized. Organizations that report only seat counts will optimize for seat counts. Those that measure AI ROI through outcome-linked KPIs will optimize for outcomes. The measurement frame is not neutral; it shapes behavior.
Equity considerations also belong in this conversation. Telemetry-based measurement is only as complete as the tools it covers. Workers who use unsanctioned AI, often in lower-wage or less IT-supported roles, are invisible in most adoption dashboards. That invisibility can skew both internal resource allocation and external policy analysis.
Policy recommendations worth acting on:
- Require question-wording disclosure in any published adoption survey.
- Distinguish extensive from intensive adoption in all official statistics.
- Fund longitudinal panel surveys that track the same firms over time rather than relying on repeated cross-sections.
- Build equity audits into measurement programs to surface distributional gaps.
Why integrating multiple data sources is harder than it looks
Combining surveys, telemetry, administrative billing data, and outcome metrics sounds straightforward on a slide deck. In practice, the integration challenges are significant enough to derail measurement programs that are otherwise well-designed.
The first problem is definitional mismatch. A survey might define an “AI user” as anyone who used an AI tool in the past 30 days. Telemetry might define it as anyone with at least five sessions in the past week. Billing data might define it as anyone on an active seat. These three definitions produce three different numbers for the same population, and reconciling them requires explicit crosswalks that most organizations have never built.
The second problem is timing misalignment. Survey data arrives monthly or quarterly. Telemetry is near real time. Outcome data may lag by weeks or months depending on the business process. Aligning these streams into a coherent dashboard requires a data pipeline that most internal BI teams are not staffed to maintain.
The third problem is coverage gaps. Telemetry covers sanctioned tools. Surveys cover whatever the respondent chooses to report. Administrative data covers what IT provisioned. None of them covers shadow AI fully. A well-designed analytics dashboard that layers these sources with explicit coverage annotations is more honest and more useful than one that presents a single composite number as if it were complete.
The practical answer is to start with two sources, not five. Pair usage telemetry with a single outcome metric for one function. Prove the integration works, then expand. Trying to build a unified data model across all sources in the first quarter is the fastest way to produce a dashboard that nobody trusts.
Ethical considerations and data privacy when collecting AI adoption data
Measuring how employees use AI tools raises real ethical questions that go beyond GDPR checkbox compliance. The core tension is between organizational visibility and individual privacy. Employees have a legitimate interest in not having every prompt they write analyzed and attributed to them personally. Organizations have a legitimate interest in understanding whether their AI investments are working.
The resolution is not to choose one over the other. It is to design measurement systems that collect what is necessary for decision-making and nothing more. Prompt content is almost never necessary for adoption measurement. Frequency, tool type, team attribution, and outcome correlation are. A system that logs prompt volume by team without storing prompt content gives organizations the signal they need without creating a surveillance record.
Consent and transparency matter practically, not just ethically. Employees who know they are being monitored and understand why are more likely to use sanctioned tools rather than routing around them. Covert monitoring tends to produce the shadow AI problem it is trying to solve.
Data retention policies deserve explicit attention. Adoption measurement data that is kept indefinitely creates risk: it can be subpoenaed, breached, or repurposed. A 90-day rolling retention window for granular telemetry, with aggregated summaries retained longer, is a reasonable default for most organizations.
Finally, measurement programs should be audited for disparate impact. If adoption dashboards consistently show lower engagement scores for certain demographic groups, the question is whether those groups have less access, less training, or less relevant use cases, not whether they are less capable. Measurement that feeds performance reviews without that audit creates legal and reputational exposure.
Key Takeaways
Measuring AI adoption rates requires outcome-linked KPIs, disclosed survey methodology, and a pre-deployment baseline to produce results that are credible and actionable.
| Point | Details |
|---|---|
| Survey wording drives the headline number | The BTOS question change shifted measured U.S. firm adoption significantly; always disclose question wording. |
| Seat counts measure procurement, not impact | Active-user rates and proficiency scores are more meaningful than license counts for assessing real behavioral change. |
| Baseline before go-live | Without a pre-deployment baseline, post-hoc attribution of AI-driven improvement is unreliable and commonly overstated. |
| Shadow AI is a measurement gap | Discovery scans and behavioral fingerprinting should precede governance to avoid driving covert workarounds that reduce visibility. |
| Tekkr Configurato closes the loop | Tekkr’s platform tracks spend by team, surfaces outcome-linked usage data, and drives adoption higher through gamified enablement. |
The measurement gap nobody talks about
The conventional wisdom on AI adoption measurement is that more data is better. Run more surveys, add more telemetry, build a bigger dashboard. The problem is that most organizations are already drowning in adoption data and still cannot answer the one question that matters: is AI making us better at our jobs?
The measurement programs that actually change decisions share one characteristic: they are built backward from a specific business question. Not “how many people are using AI?” but “is AI reducing our time-to-hire?” or “is AI improving first-call resolution in support?” The adoption rate is then a diagnostic, not a goal. When it drops, you investigate. When it rises without a corresponding outcome improvement, you investigate harder.
The other thing most guides miss is the political dimension of measurement. Adoption dashboards are not neutral artifacts. They create winners and losers inside organizations. The team with 80% adoption looks good; the team with 20% looks like a problem. That dynamic can push teams to game the metrics, running AI tools in the background to inflate counts, rather than use them well. The antidote is to make proficiency and outcome metrics the primary leaderboard, not raw usage. AI fluency, the ability to spot leverage, prompt effectively, and evaluate output quality, is becoming a hiring and performance requirement. Measure that instead.
Tekkr gives you the measurement infrastructure to act on this
Most organizations that buy AI tools spend months trying to answer basic questions: who is using what, what is it costing by team, and is any of it working? Tekkr Configurato answers all three in about 10 minutes of setup, with no browser extensions and no credit card required.
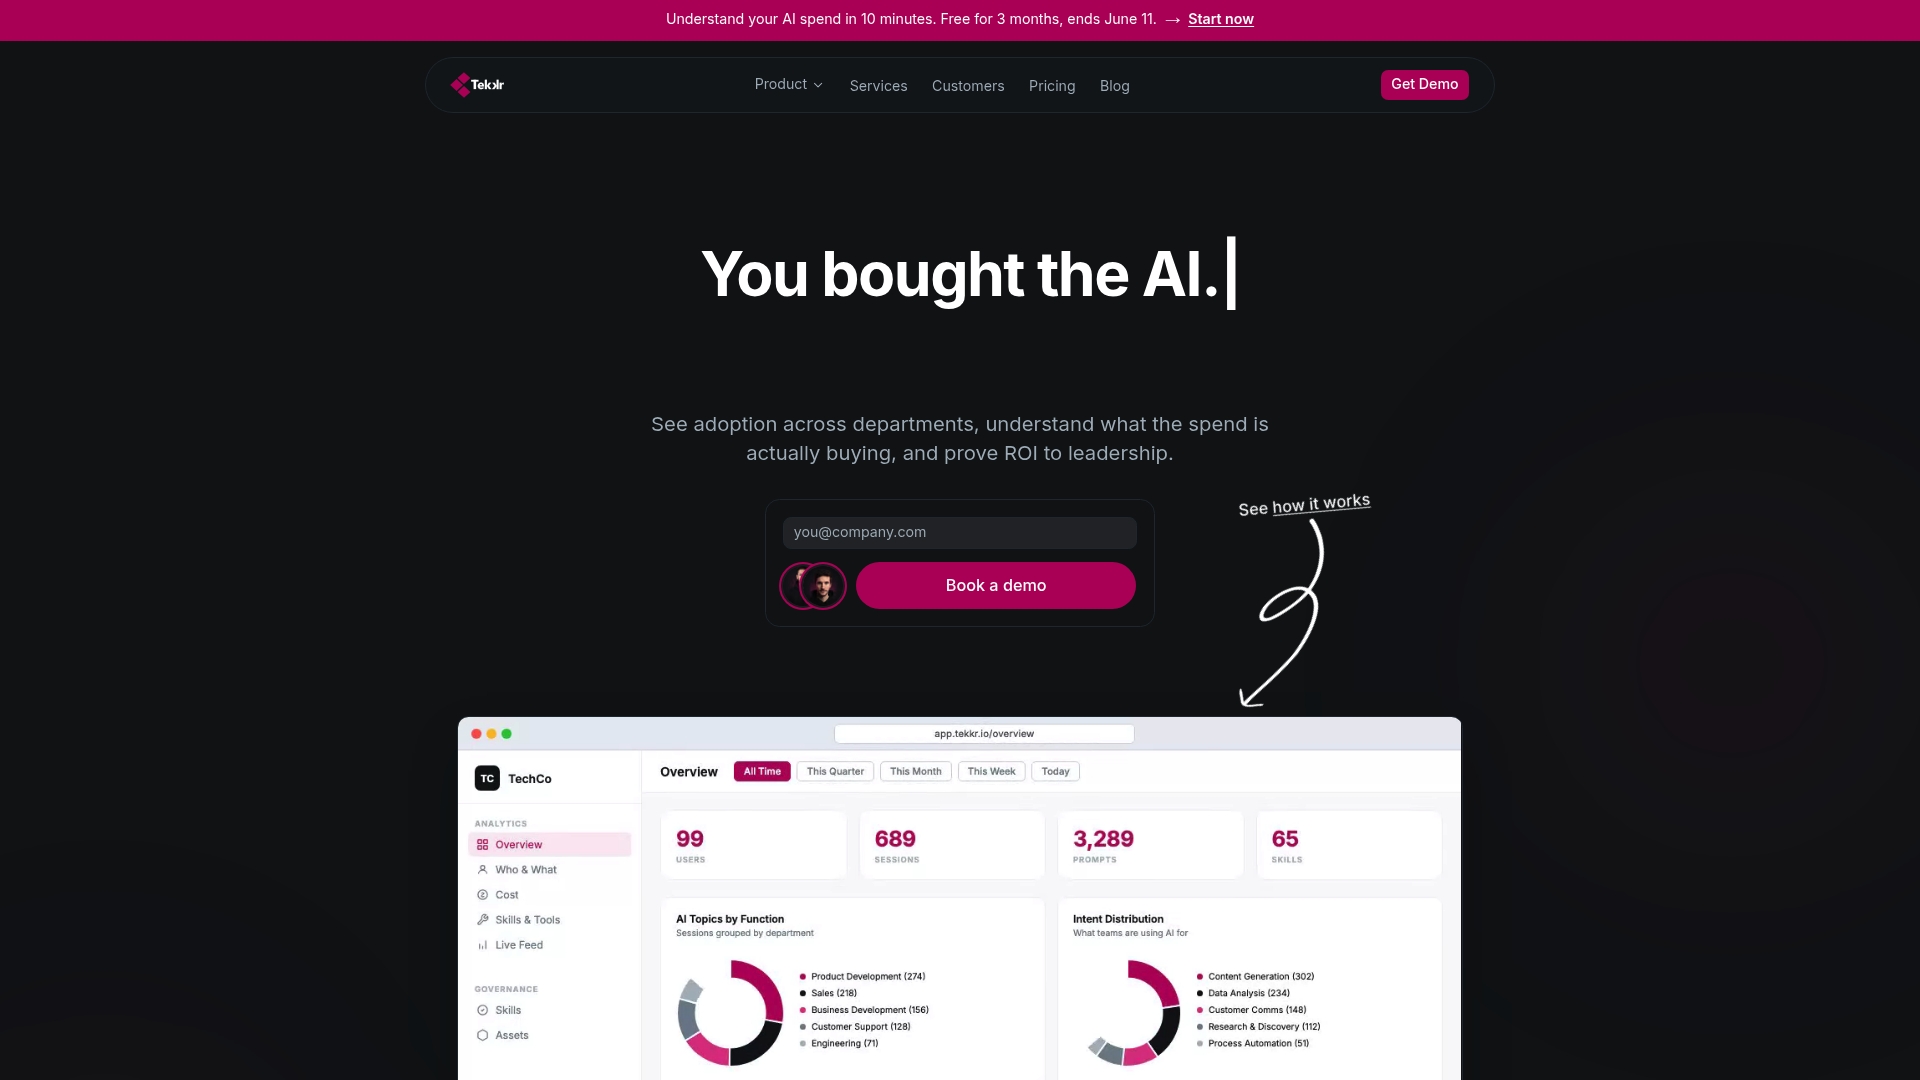
The concrete difference from building this yourself: Configurato tags spend at the team level automatically, surfaces outcome-linked usage intelligence, and runs gamified enablement to lift adoption where measurement shows it is lagging. Privacy controls are built in from the start, with end-to-end encryption, automatic PII stripping, and GDPR compliance, so your legal and IT teams do not become blockers. For enterprises ready to move from “we bought AI” to “we can prove it’s working,” the Tekkr AI adoption solution is the fastest path from measurement gap to measurement program. Start your free baseline today at tekkr.io/product/adoption.
Useful sources for further reading
-
Monitoring AI Adoption in the U.S. Economy — Federal Reserve Board of Governors (FEDS Notes): The authoritative U.S. government framework for tracking AI diffusion at the economy level; essential reading for anyone designing a policy-aligned measurement program.
-
Measuring AI Adoption among Firms: How You Ask Matters — Federal Reserve Bank of St. Louis: The natural experiment showing how BTOS question wording shifted measured firm adoption from roughly 7% to roughly 17%; the single most important methodological reference for survey designers.
-
The Who, What, and Where of AI Adoption in America — MIT Sloan Management Review: Covers distributional patterns across industries, firm sizes, and geographies; useful for benchmarking your organization’s adoption figures against national data.
-
Why Four Tech Companies Say Adoption Is the Wrong AI Metric — Time/Charter: Practitioner case for shifting from adoption counts to proficiency and outcome metrics; grounded in real enterprise experience.
-
How to Measure AI Success: KPIs, Metrics & Framework — Alice Labs: A five-layer measurement framework (technical, operational, business ROI, adoption, strategic) with guidance on baseline requirements and reporting cadence.
-
You’re Measuring AI Adoption. Measure This Instead. — Scott Armbruster: Concise practitioner argument for proficiency and outcome KPIs over seat counts; useful for internal presentations to finance and HR stakeholders.