
Adopt a four-layer, finance-first AI ROI framework that ties unit economics to fully loaded AI spend, then report one CFO-grade metric to your board. That’s the prescription. CloudZero’s 2026 survey found 34% of finance leaders cannot produce a credible AI ROI number for their initiatives. With enterprise AI spending reaching $644 billion in 2025, that gap is a board-level liability. Your next step this week: define one business outcome, capture a 30-day baseline, and assign a named owner. Tekkr’s Configurato is the recommended tooling path for inventory, attribution, and executive reporting once that baseline exists.
Key Takeaways
Measuring AI impact requires a four-layer framework, a fully loaded cost denominator, and one CFO-grade metric reported on a fixed cadence.
| Point | Details |
|---|---|
| Start with a baseline | Capture 30 days of pre-intervention data before any AI tool goes live. |
| Use cost per outcome | Divide fully loaded AI spend by outcomes produced; trend it over time. |
| Tag spend as COGS or OPEX | Classification changes your gross margin math and your forecasting model. |
| Gate scaling on pilot results | Require a documented payback period before expanding any initiative. |
| Tekkr Configurato | Centralizes inventory, attribution, and board-ready reporting in one privacy-first platform. |
Table of Contents
- Why measuring AI impact in lean enterprise environments keeps failing
- The four-layer Enterprise AI ROI framework
- Which KPIs will your CFO actually accept?
- A practical 6-step playbook to run this quarter
- How to inventory, classify, and forecast AI spend
- What to instrument and where Tekkr + Configurato fits
- How to scale validated pilots without losing measurement discipline
- Measurement mistakes that kill ROI claims
- A one-page reporting template and operating rhythm
- Your 30/90/180-day checklist
- Sources
Why measuring AI impact in lean enterprise environments keeps failing
Many AI measurement programs face challenges because finance and product teams use different metrics. Product teams count seat activations, and finance sees subscription invoices. Neither directly links to business outcomes.
CloudZero’s survey makes the problem concrete: one in three finance leaders cannot connect AI spend to a credible ROI figure. Meanwhile, Trantor’s analysis shows most generative AI pilots failed to deliver measurable P&L returns despite massive capital outlay. The capability exists. The measurement discipline does not.
Three consequences land directly on the CFO and board:
- Margin erosion: Usage-based AI costs scale with product volume, but without COGS tagging, they hide inside undifferentiated cloud spend until a quarterly close reveals the damage.
- Wasted spend: Organizations commonly discover 30–50 AI tools in a single audit, with significant overlap in function. Consolidating redundant tools typically saves 15–25% immediately.
- Failed pilots: Without a pre-defined value hypothesis and a baseline, there is no way to distinguish a genuinely underperforming tool from one that simply wasn’t measured.
The four-layer Enterprise AI ROI framework
The four layers are: Utilization → Productivity → Business Outcomes → Strategic Value. Early-stage pilots live in layers one and two. Scaled programs must reach layer three before the board will accept the ROI claim.
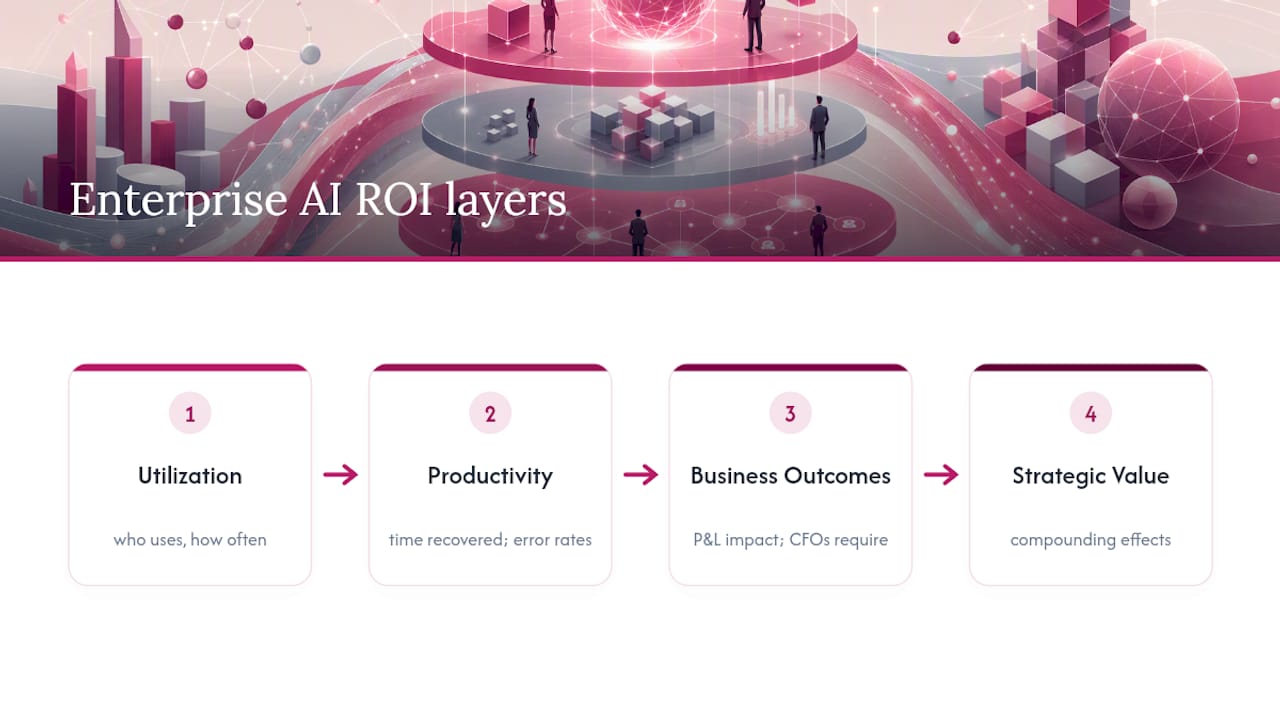
Layer 1: Utilization. Measures who uses what, how often, and whether adoption is growing. Example metric: weekly active users per licensed seat. This layer is necessary but not sufficient. Adoption is an input, not an outcome; DAU/MAU tells you the tool is running, not that it’s working.
Layer 2: Productivity. Measures time recovered, throughput gained, or error rates reduced at the task level. Example metric: average time to close a support ticket before and after AI assist. Attribution here is usually a before/after comparison with a control group or holdout cohort.
Layer 3: Business Outcomes. Connects productivity gains to P&L lines: cost per outcome, revenue attribution, margin impact. This is the layer CFOs require. A/B tests and holdout groups are the gold standard for attribution; phased rollouts with a matched control team work when randomization isn’t feasible.
Layer 4: Strategic Value. Captures compounding effects: faster product velocity, reduced vendor dependency, talent retention from better tooling. Quantify where possible; qualify where not. Microsoft Digital’s multi-value framework explicitly tracks productivity, cost savings, quality, risk, revenue, and coverage in parallel, with a monthly review cadence to keep each layer current.
Which KPIs will your CFO actually accept?
Five metrics survive the finance review: cost per outcome, revenue attribution, margin impact, payback period, and scale efficiency.
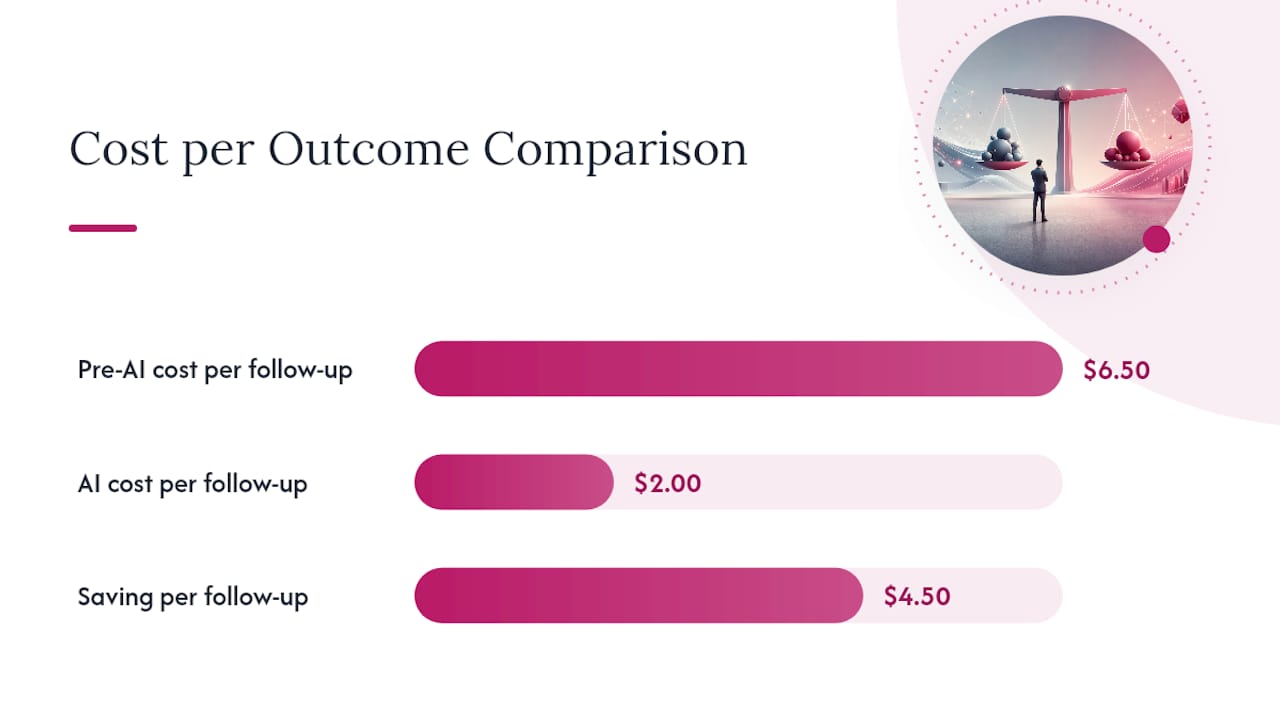
Cost per outcome is the most defensible unit. Divide fully loaded AI cost (tools + infrastructure + engineering time) by the number of outcomes produced. For a support automation initiative: if the AI stack costs $8,000/month and handles 4,000 ticket follow-ups, cost per follow-up is $2.00. Compare that to the pre-AI cost of $6.50 per follow-up (agent time at fully loaded rate), and the delta is $4.50 per ticket, or $18,000/month in savings.
Payback period follows directly. If implementation cost $45,000 (setup, integration, training), payback arrives in 2.5 months at $18,000/month savings. That’s a number a CFO can put in a slide.
A finance-table template for any initiative:
Pro Tip: Use a conservative conversion factor when valuing recovered hours. This makes the ROI claim auditable and defensible when finance pushes back.
A practical 6-step playbook to run this quarter
- Define the value hypothesis. Name the specific business metric you expect to improve, by how much, and over what period. “Reduce cost per support ticket by 30% within 90 days” is a hypothesis. “Improve efficiency” is not.
- Inventory AI spend. Pull every subscription, API line, and embedded SaaS feature into one register. Cledara’s framework covers three buckets: subscription seats, API consumption, and embedded features. Average dedicated AI-tool spend is substantial for companies annually, but most organizations are spending more once embedded features are counted.
- Baseline current state. Measure the target metric for 30 days before any AI intervention. No baseline, no ROI claim.
- Instrument telemetry. Connect provider usage APIs, billing exports, and product delivery metrics (ticket throughput, PR merge rate, document volume) to a central data store.
- Run a controlled test or phased rollout. Use a holdout group or matched cohort. Run for at least one full business cycle before drawing conclusions.
- Review and reinvest or kill. At the end of the test period, compare cost per outcome against baseline. If the delta is positive and statistically meaningful, scale. If not, document why and reallocate.
Measurement cadence: weekly for utilization dashboards, monthly for productivity reviews, quarterly for business outcome rollups and board reporting.
Data ownership matters here. Assign one named owner for each initiative’s measurement data, and store raw telemetry in a system your finance team can audit independently of the AI vendor.
How to inventory, classify, and forecast AI spend
Capture three spend buckets and centralize billing visibility before you do anything else. The three buckets: subscription seats, API/consumption charges, and embedded SaaS features (AI capabilities bundled inside tools your teams already pay for, like Salesforce Einstein or GitHub Copilot inside a broader GitHub contract).
A spend register template:
BRM.ai’s guidance is direct: classify customer-facing inference as COGS and internal productivity spend as OPEX. That classification changes your gross margin calculation and your forecasting model. A customer-facing inference line scales with revenue; an internal OPEX line scales with headcount. Treat them differently in your model.
For forecasting: baseline 3–6 months of consumption, then build three scenarios (best/likely/worst) using growth rate assumptions tied to product roadmap milestones. Add anomaly detection thresholds and per-team token budgets to prevent runaway spend.
What to instrument and where Tekkr + Configurato fits
The minimum telemetry set: provider usage APIs, billing exports, SSO/identity logs, and product delivery metrics (ticket throughput, feature velocity, document volume). Without all four, you cannot connect spend to outcome.
Instrumentation steps:
- Pull admin API data from each AI provider (OpenAI, Anthropic, GitHub) on a daily schedule.
- Export billing data to a centralized spend database tagged by team, project, and cost type.
- Trace commits and Jira tickets to AI-assisted initiatives using branch naming conventions or labels.
- Track DAU/MAU per licensed seat to surface underutilized subscriptions.
- Supplement system telemetry with periodic team surveys to capture qualitative signals like tool satisfaction and change confidence.
Tekkr’s Configurato handles this stack end-to-end: it inventories AI tool usage across the organization, breaks down costs by team, surfaces use-case intelligence, and generates executive rollup templates. Setup takes about 10 minutes, with no browser extensions required. The architecture is end-to-end encrypted, GDPR-compliant, and strips PII from prompts automatically, so your legal and privacy teams don’t need to be involved in every instrumentation decision.
OpenAI recommends measuring “Useful Intelligence per Dollar”, a full-cost metric that includes employee review time and rework, not just raw token cost. Configurato’s cost-per-outcome reporting aligns directly with this approach.
How to scale validated pilots without losing measurement discipline
Require measurable impact at the initiative level before scaling. The gate checklist: baseline quality confirmed, cost per outcome calculated, holdout results documented.
Expected timelines by initiative type:
- Support automation: 1 quarter to a validated pilot with payback analysis.
- Engineering productivity: 2 quarters, because PR throughput and code quality signals take longer to stabilize.
- Platform or infrastructure AI: 6–18 months, given the complexity of attribution across shared services.
Governance at scale means a prioritized initiative backlog, a common reporting template for rollups, and a quarterly portfolio review where each initiative either earns continued investment or gets reallocated. Atlassian’s four-stage maturity model (explore → optimize → enhance → transform) is a useful reference for setting leadership expectations at each gate.
Measurement mistakes that kill ROI claims
- Missing denominator: Reporting cost savings without including engineering time, infrastructure, and management overhead inflates ROI. Fully load every cost line.
- Counting adoption as ROI: Seat activation and DAU are inputs. Tracking why adoption rates matter is useful context, but the board needs a business outcome, not a usage chart.
- No baseline: Without a pre-intervention measurement, any improvement claim is anecdotal. Finance will not accept it.
- Poor attribution: Claiming that a 15% productivity gain came from an AI tool when the team also hired three engineers in the same quarter is not credible. Use holdouts or matched cohorts to isolate the AI effect.
- Gaming the metric: If the KPI is “time saved on ticket follow-ups,” agents can artificially inflate baseline times. Define metrics at the system level (total tickets closed per agent-hour) rather than the task level.
A one-page reporting template and operating rhythm
The headline metric at the top of every board report should be AI-driven cost savings as a percentage of OPEX for cost-focused programs, or AI-attributed revenue as a percentage of new ARR for growth-focused ones. Pick one and hold it for at least two quarters so the board can track a trend.
Report fields for each initiative: initiative name, owner, baseline metric, current metric, delta, cost per outcome, payback period, recommended action (scale / hold / kill).
Operating rhythm:
- Weekly: Utilization dashboards reviewed by AI product owners. Flag underutilized seats and anomalous spend.
- Monthly: Project-level reviews with finance. Update cost per outcome and productivity delta. Microsoft’s monthly KPI cadence is the benchmark here.
- Quarterly: Board-level rollup. Present portfolio summary, top three initiatives by ROI, and one kill or reallocation decision.
Your 30/90/180-day checklist
- Day 30 (Finance owner): Complete AI spend inventory across all three buckets. Establish one baseline metric for the highest-priority initiative. Assign data ownership.
- Day 30 (AI product owner): Instrument provider usage APIs and connect billing exports to a central spend database. Confirm telemetry coverage for the pilot initiative.
- Day 90 (AI product owner + Finance owner): Complete one controlled pilot with holdout group. Produce a cost-per-outcome calculation and payback analysis. Present to CFO.
- Day 90 (Platform/Infra): Tag all AI cost lines as COGS or OPEX in the billing system. Build a 3-scenario forecast for the next two quarters.
- Day 180 (AI product owner): Scale the validated pilot to the next function or team. Produce the first quarterly board rollup using the one-page reporting template.
- Day 180 (Finance owner): Publish the portfolio-level metric (AI savings as % of OPEX or AI-attributed ARR). Set the reinvestment threshold for the next planning cycle.
The measurement gap is the real problem, not the technology
What Tekkr consistently sees across enterprise customers is the same pattern: fragmented spend across dozens of tools, no shared baseline, and adoption metrics presented to the board as ROI. Configurato short-circuits that cycle by centralizing inventory, attributing costs by team, and generating the executive templates finance actually needs. The playbook in this article reflects what works in practice. The AI impact tracing methods and ROI measurement approaches covered here are grounded in enterprise deployments, not theory.
Tekkr + Configurato: from playbook to proof
You now have the framework. The gap between having it and executing it is instrumentation, and that’s where most programs stall.
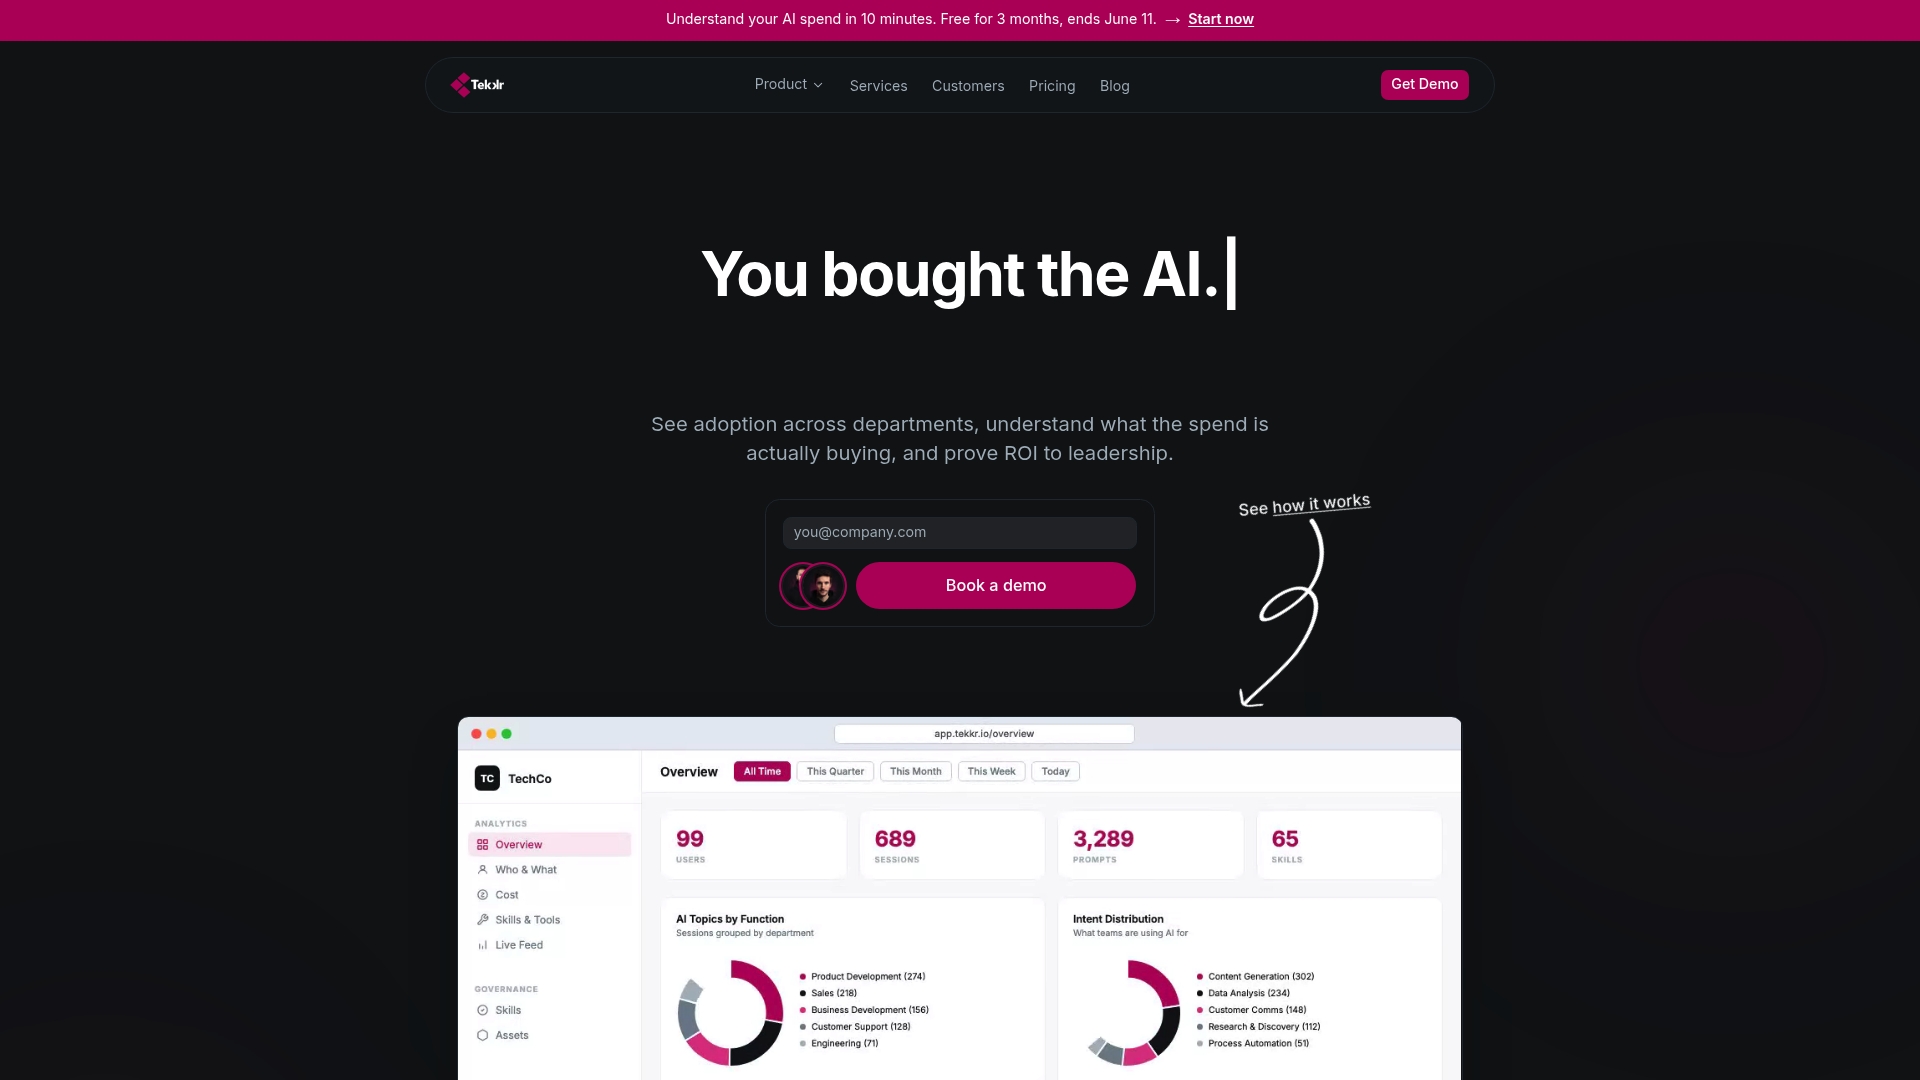
Configurato maps directly to every step in this playbook: it inventories AI tool usage across your organization, breaks costs down by team and project, surfaces which use cases are actually delivering throughput, and generates the executive rollup templates your CFO needs for the quarterly board report. Three capabilities that matter most:
- Inventory and chargeback: Automatic discovery of subscription seats, API consumption, and embedded features, with per-team cost allocation.
- Telemetry and dashboards: Integrations with Claude, Codex, and other AI assistants, with usage and spend data in one place, no browser extensions, no PII exposure.
- Executive rollups and playbooks: Gamified adoption leaderboards and company-wide AI playbooks that lift utilization, paired with one-click board-ready reports.
Setup takes 10 minutes, there’s a free tier, and no credit card is required. See how Configurato works and start your first spend inventory this week.
Sources
- How to measure AI ROI: metrics and a framework
- Measuring the impact of our AI investments in IT at Microsoft
- How to Track and Control AI Spend Across Your Company | Cledara
- AI Token Spend 101: A Finance Leader’s Guide
- AI ROI Framework: Measure, Prove & Scale Enterprise AI Returns