
The most useful AI savings metrics are headcount avoided (FTEs), hours saved per task, fully loaded cost per task, error-rate reduction, and revenue uplift. Each maps directly to a P&L line your CFO already tracks. The fastest way to compute them: start with a pre-deployment baseline, instrument task-level timers, and apply the formulas below.
Here are the core metrics with one-line calculation templates:
- FTEs avoided = total hours saved per year ÷ 2,080 (standard annual FTE hours)
- Hours saved per task = baseline handle time − post-AI handle time × adoption rate
- Fully loaded cost per task = (salary + benefits + overhead) per hour × hours per task + tooling cost per task
- Cost avoided = FTEs avoided × fully loaded annual cost per FTE
- Error-rate reduction savings = (baseline errors − post-AI errors) × cost per error
- Revenue uplift = hours recovered × revenue potential per hour × realistic conversion rate
The SaaS CFO framework organizes these into four layers: direct cost savings, work performed, outcomes, and business impact. OpenAI’s Useful Intelligence per Dollar concept pushes further: divide the value of a successful task by its fully loaded cost (tooling + labor + review + rework), not just token spend. Tekkr’s Configurato platform surfaces all of these as dashboard KPIs, pulling telemetry from actual tool usage rather than estimates.
| Metric | Formula | Data Source |
|---|---|---|
| FTEs avoided | Hours saved ÷ 2,080 | Time sheets, task timers |
| Cost avoided | FTEs avoided × fully loaded FTE cost | Payroll, HR system |
| Cost per task (fully loaded) | (Hourly labor cost × task hours) + tooling cost | Payroll, invoices |
| Error-rate reduction | (Baseline errors − post-AI errors) × cost per error | Ticket system, QA logs |
| Revenue uplift | Hours recovered × revenue potential × conversion rate | CRM, finance |
Table of Contents
- What are the best KPI formulas to quantify AI savings?
- Three worked examples of AI cost savings calculations
- How do you measure and attribute AI savings reliably?
- When will AI savings show up, and what do CFOs expect?
- Common mistakes that undermine AI savings claims
- How Configurato maps telemetry to finance-ready KPIs
- Key Takeaways
- The flywheel most enterprise leaders miss
- Prove your AI investment is working with Tekkr
- Sources and further reading
What are the best KPI formulas to quantify AI savings?
Finance teams accept AI savings claims only when the numbers trace back to instrumented data. The four-layer measurement approach requires you to build from the bottom up: instrument costs first, then work performed, then outcomes, then business impact.
Key KPI definitions:
- Gross margin improvement = (post-AI gross profit − baseline gross profit) ÷ baseline revenue
- Cycle time reduction = baseline process duration − post-AI process duration (in hours or days)
- Human review rate = tasks requiring human review ÷ total AI-processed tasks
- CSAT/NPS uplift = post-AI score − baseline score, tracked monthly
To translate hourly savings into P&L line items: multiply hours saved by fully loaded hourly cost to get an Opex reduction figure. If those hours are reallocated to revenue-generating work, model the revenue potential separately and apply a conservative conversion factor (30–40% is defensible for most enterprise contexts).
Pro Tip: Never use cost per token as your primary business metric. Calculate Useful Intelligence per Dollar instead: divide the fully loaded cost of a successful outcome (tooling + labor + review + rework) by the number of successful tasks. A cheap model with high rework rates often costs more per successful outcome than a premium model with low error rates.

Practitioners who capture fully loaded labor costs before deployment produce far more credible ROI numbers than those who reconstruct “before” figures from memory after the fact.
Three worked examples of AI cost savings calculations
Support automation
A support team handles 10,000 tickets per month. Baseline handle time is 12 minutes per ticket. After deploying an AI assist tool with 70% adoption, average handle time drops to 7 minutes for AI-assisted tickets.
| Input | Value |
|---|---|
| Monthly tickets | 10,000 |
| Adoption rate | 70% (about 7,000 tickets) |
| Baseline handle time | 12 min |
| Post-AI handle time | 7 min |
| Hours saved/month | 2.4 hours per developer per sprint |
| Fully loaded hourly cost | $65 |
| FTEs avoided | 3.4 FTEs |
BCG case data shows 20–30% agency cost reductions in targeted processes when pilots are scoped tightly. This support example sits comfortably in that range.
Document processing (invoices)
A finance team processes 3,000 invoices per month. Before AI: 3 staff at $10 fully loaded cost per invoice = $30,000/month. After AI, the system handles 90% automatically; staff manage 300 exceptions at $22.33 each = $6,700/month. Annual savings: $279,600. First-year net ROI after a $86,000 total investment (platform + implementation): approximately 225%.
| Input | Before AI | After AI |
|---|---|---|
| Invoices processed | 3,000 | 3,000 |
| Staff-handled invoices | 3,000 | 300 |
| Monthly cost | $30,000 | $6,700 |
| Annual savings | $279,600 |
Developer productivity
A team of 20 developers averages 8 story points per sprint. With AI code assist at 65% adoption, throughput rises to 10.4 points per sprint (a 30% gain). At an average fully loaded developer cost of $120/hour and 80 hours per sprint per developer, the productivity gain equals roughly 2.4 hours per developer per sprint recovered for higher-value work.
At enterprise scale: IBM’s internal AI deployments reached $3.5 billion in run-rate productivity savings across dozens of business functions over multiple years. That scale required layered measurement from day one, not retroactive estimation.
For developer teams, also track regression test automation as a quality signal: fewer regressions per release directly reduces rework cost and improves cycle time.
How do you measure and attribute AI savings reliably?
Attribution requires pre-deployment baselines plus instrumentation and controls. Without a documented “before,” any savings claim is unverifiable.
Four-layer measurement stack:
- Direct cost savings — labor and tool consolidation costs, measured against baseline
- Work performed — task counts, completion rates, AI vs. manual split
- Outcomes — error reduction, cycle time, CSAT
- Business impact — headcount avoided, revenue uplift, gross margin change
Step-by-step plan:
- Define baseline metrics at least 4 weeks before deployment; capture task-level time and fully loaded costs
- Set telemetry: task-level timers, ticket source tags, approval timestamps, human review flags
- Run phased deployments with a control cohort (same role, same task type, no AI access) for at least 6 weeks
- Capture adoption signals weekly: active users, task completion rate, human review rate, rework frequency
- Reconcile savings to payroll and headcount changes quarterly
Pro Tip: Treat human-in-the-loop effort and rework as part of the AI program’s cost base, not as separate overhead. A tool that saves 5 minutes per task but triggers a 3-minute human review on 60% of outputs has a true net saving of only 2 minutes — and your finance team will find that discrepancy if you don’t surface it first. See how to trace AI impact for a full telemetry checklist.
Energy optimization programs use IPMVP Option C weather-normalized baselines to validate savings. The same principle applies to AI: use a recognized baselining standard, document your methodology, and your numbers will survive a finance audit.
When will AI savings show up, and what do CFOs expect?
Simple pilots often show measurable results in 3–6 months. Complex enterprise programs normally require 12+ months to reach Layer 4 business-impact metrics.
| Phase | Timeline | Deliverable |
|---|---|---|
| Baseline capture | Weeks 1–4 | Documented task times, fully loaded costs |
| Pilot deployment | Months 1–3 | Weekly operational dashboards |
| Finance reconciliation | Month 3–6 | Monthly savings vs. baseline report |
| Board-level summary | Month 12+ | Layer 4 P&L impact, sensitivity analysis |
Minimum artifacts CFOs expect:
- Baseline reconciliation document (task times, costs, error rates before deployment)
- Calculation workbook with sourced inputs (payroll, tooling invoices, ticket data)
- Controlled cohort results showing AI vs. non-AI performance
- Sensitivity analysis on key assumptions (adoption rate, review intensity, rework rate)
For monthly reporting, track: AI vs. manual task split, error rate, hours freed, cost savings vs. baseline, and cumulative ROI vs. target. Sensitivity ranges on adoption rate assumptions are non-negotiable for credible board presentations.
Common mistakes that undermine AI savings claims
Most disputed ROI claims trace back to a small set of avoidable errors.
- Missing pre-deployment baselines — retroactive “before” estimates are the single most common source of challenged savings; instrument a 4-week baseline period before any deployment
- Using cost per token as a business metric — token cost tells finance nothing about value; replace it with cost per successful task
- Ignoring human review and rework — these are part of the AI program’s cost, not separate overhead
- Adoption lag — savings projections based on 100% adoption on day one are almost always wrong; model a ramp curve (typically 30–60% in month 1, 70–85% by month 6)
- Double-counting savings across functions — if the same hours are claimed by both the support team and the IT team, the CFO will catch it
Red flags for CFO reviewers: no controlled cohort, unverifiable “before” assumptions, missing tooling and overhead costs, and headcount reduction claimed without showing where the work went.
Pro Tip: Reconcile AI savings with actual payroll and headcount changes. If you claim 3.4 FTEs avoided but headcount stayed flat and no new revenue-generating roles were added, finance will ask where the value went. Show the reallocation explicitly — reducing wasted AI spend and redeploying those hours is a stronger story than a headcount reduction claim with no follow-through.
How Configurato maps telemetry to finance-ready KPIs
Tekkr’s Configurato platform connects usage signals to finance-ready savings metrics without requiring browser extensions or manual data entry. Setup takes about 10 minutes.
Feature-to-KPI mapping:
| Telemetry Field | KPI Produced |
|---|---|
| Active users by team | Adoption rate, adoption curve |
| Task completion events | Tasks per user, AI vs. manual split |
| Cost allocation by team | Cost per completed task (fully loaded) |
| Human review flags | Human review rate, rework frequency |
| Prompt metadata (anonymized) | Useful Intelligence per Dollar score |
Dashboard metrics Configurato surfaces: active users by team, cost per completed task, adoption curve over time, Useful Intelligence per Dollar score, and reconciliation lines to payroll data. All prompts are anonymized with automatic PII stripping, and the architecture is end-to-end encrypted and GDPR-aligned, so aggregate results can be shared with finance without exposing individual employee data. For full details on the privacy architecture, Tekkr publishes its security and privacy specifications publicly.
HR teams rolling out AI tools can also reference onboarding automation adoption examples to benchmark adoption curves against comparable deployments.
Key Takeaways
Quantifying AI savings credibly requires pre-deployment baselines, fully loaded cost accounting, and a layered measurement approach that connects task-level telemetry to P&L-ready business impact metrics.
| Point | Details |
|---|---|
| Capture baselines first | Document task times and fully loaded costs at least 4 weeks before any AI deployment. |
| Use fully loaded cost per task | Include salary, benefits, overhead, tooling, review, and rework — not just token or infrastructure cost. |
| Layer your measurement | Move from direct cost savings through work performed and outcomes before claiming Layer 4 business impact. |
| Set realistic timelines | Simple pilots show results in 3–6 months; complex enterprise programs need 12+ months for board-level metrics. |
| Tekkr Configurato | Maps usage telemetry to finance-ready KPIs — active users, cost per task, adoption curve, and Useful Intelligence per Dollar — in a privacy-first architecture with 10-minute setup. |
The flywheel most enterprise leaders miss
The conventional wisdom treats AI savings as a cost-reduction exercise. That framing is too small. Early savings, when documented with the rigor described here, become the proof points that unlock the next round of AI investment. The real opportunity is a flywheel: save, reinvest, scale.
IBM’s internal AI program is the clearest public example of this logic. The $3.5 billion in run-rate savings was not a one-time event. It was the result of treating each early win as a credibility-building pilot, measuring it against a documented baseline, and using the results to fund the next deployment. IBM’s leadership called this the “Client Zero” approach: prove it internally first, then scale it.
The measurement layers described in this article are not bureaucratic overhead. They are the mechanism that makes reinvestment defensible to a board. A CFO who sees a reconciled calculation workbook with a controlled cohort result will approve the next phase. One who sees a slide deck with unverifiable assumptions will not. Translate every technical metric into P&L language before the board meeting, not after.
Prove your AI investment is working with Tekkr
You have the formulas. The next step is instrumenting them without building a measurement stack from scratch.
Tekkr’s Configurato gives you the telemetry and dashboards to run every calculation in this article from day one. In month 0, Configurato captures baseline usage, cost allocation by team, and task-level completion signals. By months 1–3, it reports active users, cost per completed task, adoption curves, and a Useful Intelligence per Dollar score your finance team can reconcile against payroll. The artifacts it produces — calculation workbooks, adoption dashboards, and sensitivity-ready KPI exports — are exactly what CFOs expect at the quarterly review.
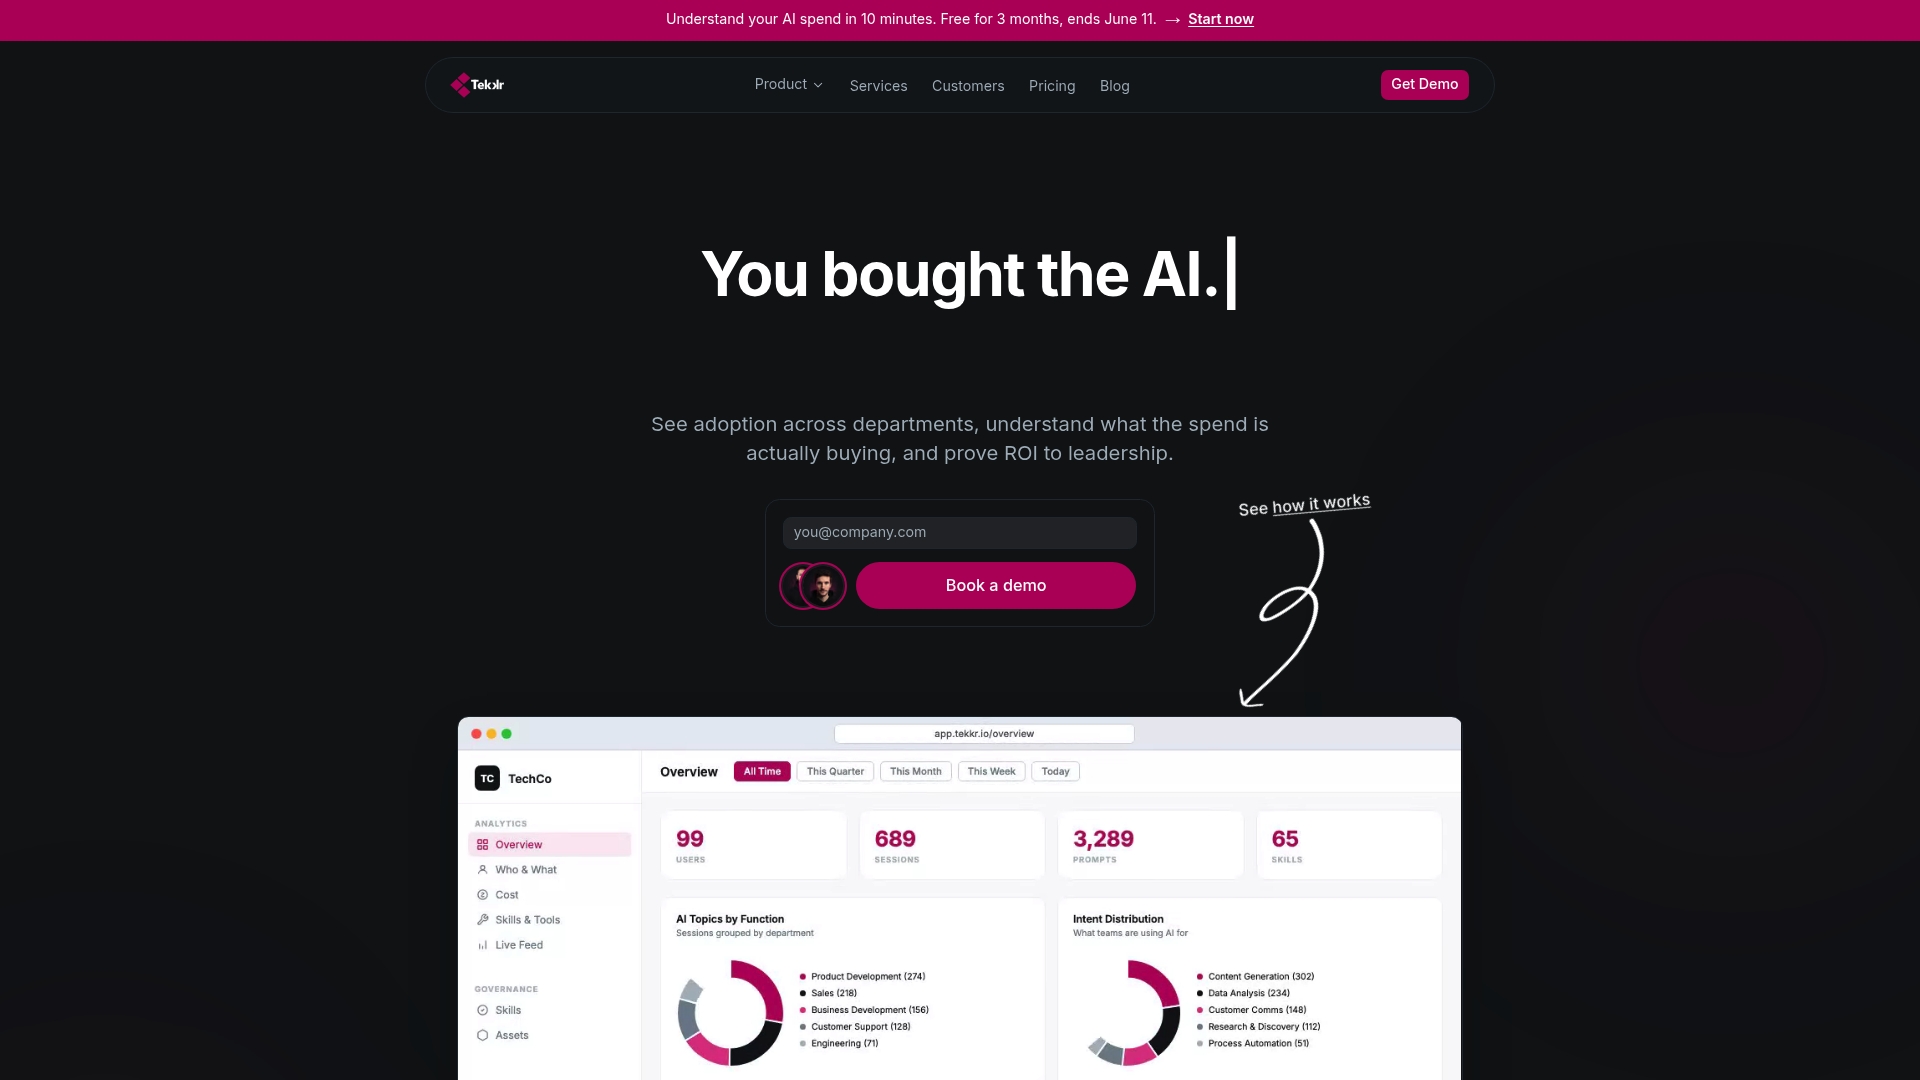
Everything runs in a privacy-first, end-to-end encrypted architecture with automatic PII stripping and no browser extensions required. Setup takes about 10 minutes, and there is a free tier with no credit card required.
Start your Configurato pilot and hand your CFO a reconciled savings report within 90 days.
Sources and further reading
Frameworks and methodology:
- The Four Layers of AI Measurement: A CFO’s Framework — The SaaS CFO’s layered approach to connecting AI telemetry to P&L impact
- A Scorecard for the AI Age — OpenAI’s Useful Intelligence per Dollar concept and full-cost accounting guidance
- Measuring AI ROI: A Framework That Actually Works — Ecosire’s practical guide to baselines, fully loaded costs, and ROI calculation templates
- How Businesses Can Measure AI Success with KPIs — TechTarget guidance on measurement timelines and KPI selection
Case studies:
- How IBM Saved $3.5 Billion With AI Agents in Two Years — IBM’s Client Zero multiyear productivity program with named metric improvements
- How Four Companies Use AI for Cost Transformation — BCG case studies covering marketing, R&D, and supply chain savings
- AI Agent Saved Manufacturing Client $200K/Year — Decomposed savings by category with a 2.8-month payback calculation
- Maintenance Optimization Agent Delivers $650K Savings — Asset-level AI savings with statistical reliability modeling
- How Dollar Tree Saved 20% on HVAC Energy with BrainBox AI — IPMVP-validated energy savings across 616 stores
Tekkr resources:
- Ways to Measure AI ROI for Business Leaders — CFO-facing KPI definitions and finance reconciliation guidance
- AI Adoption and Configurato — Tekkr’s pilot program and measurement platform