
Employee engagement analytics, in the AI context, means tracking three things: who has access to your AI tools, who actually uses them in meaningful ways, and what realized value that use produces relative to what you’re spending. Start by instrumenting event-level usage for one priority workflow and mapping that spend to your organizational cost centers. Those two moves produce the first board-ready evidence your investment is working.
The three metrics to capture immediately:
- Access-to-active-user conversion rate: the share of licensed users who perform at least a defined threshold of meaningful AI actions in a given period
- Active-user cost: total AI spend divided by active users in that period
- Realized value per active user: a leading indicator like cycle time reduction or quality delta tied to a specific workflow
According to Dun & Bradstreet’s AI Momentum Survey of 10,000 businesses, 76% of enterprises report at least some measurable ROI from AI, yet only 6% say their enterprise data is fully ready to support AI at scale.
That gap is where most measurement programs stall.
Key Takeaways
Effective employee engagement analytics for AI requires measuring access, active use, and realized value tied to spend by team, then using those signals to steer investment before the quarterly P&L review.
| Point | Details |
|---|---|
| Lead with active-user conversion | The gap between licensed seats and meaningful use is where most AI ROI disappears. |
| Only 6% of enterprises are data-ready | Fix HR, billing, and task-system integration before scaling measurement programs. |
| Run controlled experiments | Before/after snapshots on the same group confound AI impact with other variables; use matched controls. |
| Report leading indicators to finance | Cycle time delta, quality delta, and upskilling rate move early enough to steer decisions. |
| Tekkr’s Configurato | Instruments event-level usage, maps spend to cost centers, and surfaces dashboards in 4–8 weeks. |
Table of Contents
- Why spreadsheet ROI fails for GenAI
- What are the core AI engagement metrics to track?
- How to design defensible impact measurements
- How to instrument usage data without exposing PII
- How to run a pilot and scale to the enterprise
- How to report AI engagement analytics to the C-suite
- Common pitfalls when measuring employee AI engagement
- How Tekkr’s Configurato operationalizes this measurement
- What transformation leaders wish they’d known
- Tekkr gives you the measurement infrastructure to prove AI is working
- Sources
Why spreadsheet ROI fails for GenAI
The conventional approach, a spreadsheet that divides license cost by headcount saved, misses the leading indicators and organizational AI fluency that actually predict long-term value. Three reasons this matters.
First, headcount math is a lagging signal. By the time you can attribute a headcount reduction to an AI tool, you’ve already missed six months of steering decisions. Second, activation costs are invisible in license-ratio models: the time spent on training, change management, and workflow redesign never shows up in a seat-count calculation. Third, adoption is wildly uneven across functions, and a blended average hides that variance entirely.
Federal Reserve survey data illustrates the problem: firm-level adoption estimates range from roughly 18% (BTOS business survey) to 78% (senior-leader estimates), depending on how the question is framed and who answers it. That spread isn’t noise. It reflects the difference between access and active use, which is exactly what spreadsheet ROI ignores.
Leading enterprise finance and AI executives are shifting to leading indicators: cycle time reduction, quality improvement, faster upskilling, and retention. These signals move early enough to steer investment before the quarterly P&L review.
What are the core AI engagement metrics to track?
A compact taxonomy, organized from leading to lagging:
Deloitte’s Q4 GenAI survey found that fewer than 60% of workers with AI access use it daily, and fewer than 20% of organizations have redesigned jobs to embed AI. That activation gap shows up directly in the active-user conversion metric, which is why it’s the single most important number to watch in the first 90 days.
Microsoft research on realized AI value adds a critical nuance: psychological safety and role clarity are rising predictors of whether employees extract real value from AI tools. Track these qualitative signals alongside behavioral metrics, not separately.
How to design defensible impact measurements
Rigorous measurement requires experiments or control-group comparisons, not before/after snapshots taken on the same population. A before/after on the same group confounds AI impact with seasonal variation, team changes, and tool familiarity.
A practical experiment checklist:
- Define the workflow and KPIs before touching any data. Cycle time, error rate, and output volume are the most instrumentable.
- Randomize or match controls. Assign comparable employees to treatment and control groups. If randomization isn’t feasible, match on role, tenure, and prior performance.
- Set a minimum detectable effect. For most enterprise workflows, a 10–15% cycle time improvement is a meaningful threshold worth detecting.
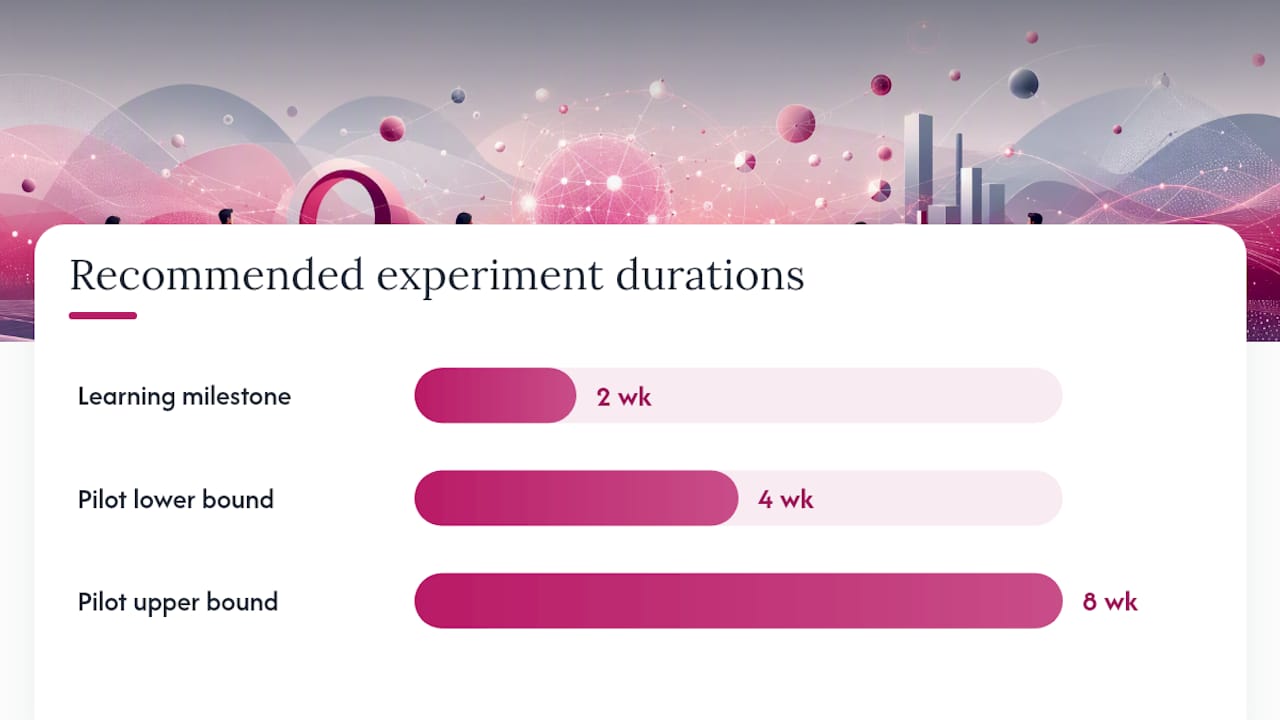
- Run for 4–8 weeks minimum. Shorter pilots underestimate the learning curve; users improve significantly after the first two weeks.
- Measure speed, quality, cost, and adaptation rate. IBM’s productivity measurement guidance recommends testing across varying skill levels and capturing lifecycle effects, not just first-week performance.
- Translate to P&L conservatively. Multiply cycle time saved by fully loaded hourly cost, apply a 50–60% realization discount for overhead and ramp, and present a range rather than a point estimate.
Pro Tip: Run many small experiments rather than one large pilot. A portfolio of micro-rollouts across three to five workflows gives you faster signal, lower risk, and a richer dataset for scaling decisions. BCG’s GenAI benchmark finds that firms excelling across enablement, KPI discipline, and adoption depth are up to 2.5x more likely to capture outsized value.
How to instrument usage data without exposing PII
Instrument event-level usage, capturing action type, timestamp, tool name, workflow context, user role, and team cost center, then reconcile that with spend data from license invoices and billing APIs. That combination is what lets you calculate cost per active user by department rather than as a blended average.
A minimal data schema requires five source types:
- AI assistant logs: action events, session IDs, prompt categories (anonymized), completion signals
- SSO and identity data: role, department, cost center, hire date
- License and billing data: seat assignments, usage tiers, invoice line items
- HR org data: reporting structure, team size, function
- Time and task systems: ticket close rates, project milestones, output counts
Privacy controls are non-negotiable at this layer. Strip PII from prompts before ingestion, apply end-to-end encryption in transit and at rest, enforce data retention limits (90 days of raw events is sufficient for most measurement programs), and document your GDPR basis for processing. For US-based deployments, align with your existing SOC 2 controls.
Pro Tip: Anonymize at the point of collection, not after. Post-hoc anonymization leaves a window where raw prompts exist in logs. Tekkr’s Configurato applies automatic PII stripping before data leaves the endpoint, which eliminates that exposure window entirely. Details on the security architecture are publicly documented.
Mapping spend to teams requires three reconciliation steps: match license seat assignments to cost centers in your HR system, allocate shared infrastructure costs by usage weight, and tag any unassigned seats as “shadow AI” candidates for investigation.
How to run a pilot and scale to the enterprise
Run focused pilots on one to three high-impact workflows, instrument them end-to-end, then use measured wins to fund the next wave. The Deloitte state of AI report points to IT, cybersecurity, operations, and customer service as the functions furthest along in GenAI integration, making them natural candidates for early pilots.
Pilot checklist:
- Select one workflow with a clear, measurable output (code review, contract drafting, support ticket resolution)
- Define two to three KPIs before launch
- Assign a control group and instrument both groups identically
- Identify three to five internal champions per team
- Run role-based training in week one, not week four
Activation tactics that move the active-user conversion rate: targeted coaching for low-frequency users, gamified leaderboards that surface top use cases without naming individuals, and AI playbooks specific to each role. Tekkr’s Configurato supports all three through its enablement layer.
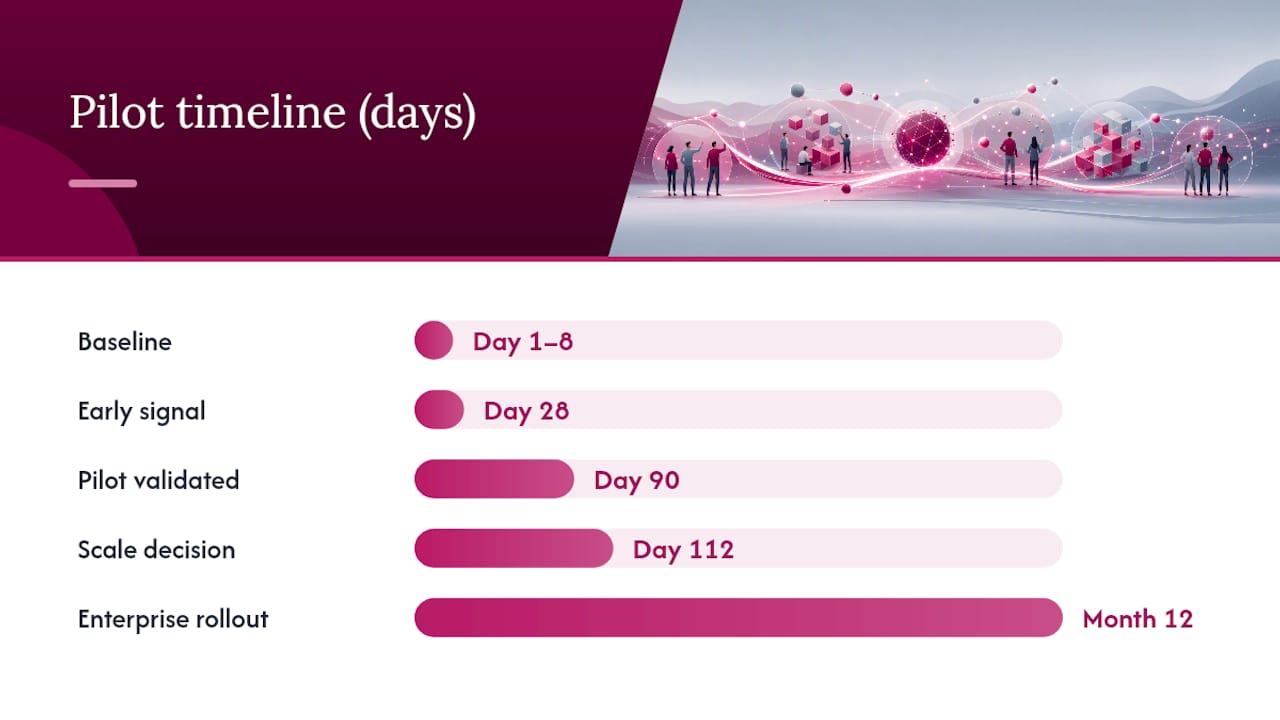
| Milestone gate | Typical timeline | Acceptance criteria |
|---|---|---|
| Baseline established | Day 1–8 | Event instrumentation live, control group assigned |
| Early signal | Day 28 | Active-user conversion >20%, cycle time delta measurable |
| Pilot validated | Day 90 | Statistically significant improvement on primary KPI |
| Scale decision | Day 112 | P&L estimate approved, governance model defined |
| Enterprise rollout | Month 12 | All target functions instrumented, quarterly P&L review cadence live |
How to report AI engagement analytics to the C-suite
Report a mix of leading indicators plus a conservative realized-value estimate and a spend-to-value ratio. Finance needs the ratio; the CEO needs the narrative; the board needs confidence bands.
A one-page executive update structure:
- Signal panel (top third): active-user conversion rate, cycle time delta, upskilling rate. These three tell the story of whether adoption is real.
- Value estimate (middle third): conservative P&L impact with a stated realization discount and confidence range.
- Action items (bottom third): one to three decisions the executive needs to make, tied to the data.
Recommended cadence: weekly activation KPIs for the transformation team, monthly value progress for the AI steering committee, quarterly P&L review for finance and the board.
What not to show: raw seat counts without behavior context, license utilization rates without workflow attribution, and cost savings projections without a stated realization discount. Each of these creates false confidence and erodes credibility with finance.
For dashboard design guidance, Tekkr’s enterprise AI adoption dashboards post covers the specific panel layouts that resonate with CFOs.
Common pitfalls when measuring employee AI engagement
Watch for measurement failures that create false confidence rather than reliable direction.
- Shadow AI: employees using personal AI accounts outside your instrumented environment. High reported adoption with low active-user conversion is the tell. Mitigation: audit SSO logs for AI-domain traffic not routed through your licensed tools.
- Seat-count illusions: 90% license utilization looks great until you check session depth. A user who opens a tool once a week is not an active user. Define “active” with a minimum action threshold before you report.
- Data readiness gaps: only 6% of enterprises report data fully ready for AI at scale. If your HR, billing, and task systems aren’t integrated, your cost-per-active-user calculation will be wrong. Fix data plumbing before scaling measurement.
- Overreliance on headcount savings: this metric takes 12–18 months to materialize and is often attributable to multiple causes. Use it as a lagging confirmation, not a primary signal.
- Mismatched incentives: if managers are rewarded for seat count rather than active use, they’ll report access as adoption. Tie at least one incentive to active-user conversion.
- Poor role clarity: Microsoft’s RIVA research shows that employees without clear role expectations for AI use extract significantly less value. This shows up as low session depth even among frequent users.
How Tekkr’s Configurato operationalizes this measurement
Tekkr’s Configurato ties event-level usage to cost centers, calculates cost per active user by team, and surfaces leading indicators in dashboards, typically within 4–8 weeks for a single instrumented workflow. Setup takes about 10 minutes and requires no browser extensions.
Core capabilities:
- Event ingestion: captures action-level usage from Claude, Codex, and other AI assistants via API integration, not browser monitoring
- License reconciliation: matches seat assignments to cost centers automatically, flagging unassigned or underused licenses
- Champion leaderboards: gamified visibility into top use cases and active users, without exposing individual prompt content
- PII stripping: automatic anonymization at the point of collection, before data enters the platform
- Executive report generator: pre-built templates for the one-page update format described above
The AI adoption solutions page covers the full feature set and consulting options for organizations that need hands-on rollout support.
For measuring AI adoption rates across functions, Tekkr’s blog provides additional implementation context.
What transformation leaders wish they’d known
The leaders who run the most effective AI measurement programs share a few hard-won lessons.
Governance before tooling. The most common failure mode is instrumenting before agreeing on what “active use” means. Get finance, HR, and the AI team aligned on metric definitions in week one, not week eight.
Enablement and incentives must move together. Deploying a tool and running one training session produces a spike in access and a flat active-user curve. The programs that sustain high conversion rates tie manager incentives to active-user metrics and run continuous, role-specific coaching rather than a single launch event.
Data readiness is a prerequisite, not a parallel workstream. If your HR system doesn’t have clean cost-center data, your spend allocation will be wrong from day one. Audit your data infrastructure before you instrument, not after you’ve committed to a reporting cadence.
Finally, qualitative signals matter more than most analytics programs acknowledge. Engagement fluctuates with the emotional arc of adoption: early enthusiasm, a confidence dip as complexity sets in, and then a rebound as users develop real mastery. Tracking that arc through pulse surveys alongside behavioral metrics gives you early warning before the dip shows up in your active-user numbers.
Tekkr gives you the measurement infrastructure to prove AI is working
Most enterprises have bought the AI. The problem is proving it’s working, to finance, to the board, and to the transformation team trying to decide where to invest next.
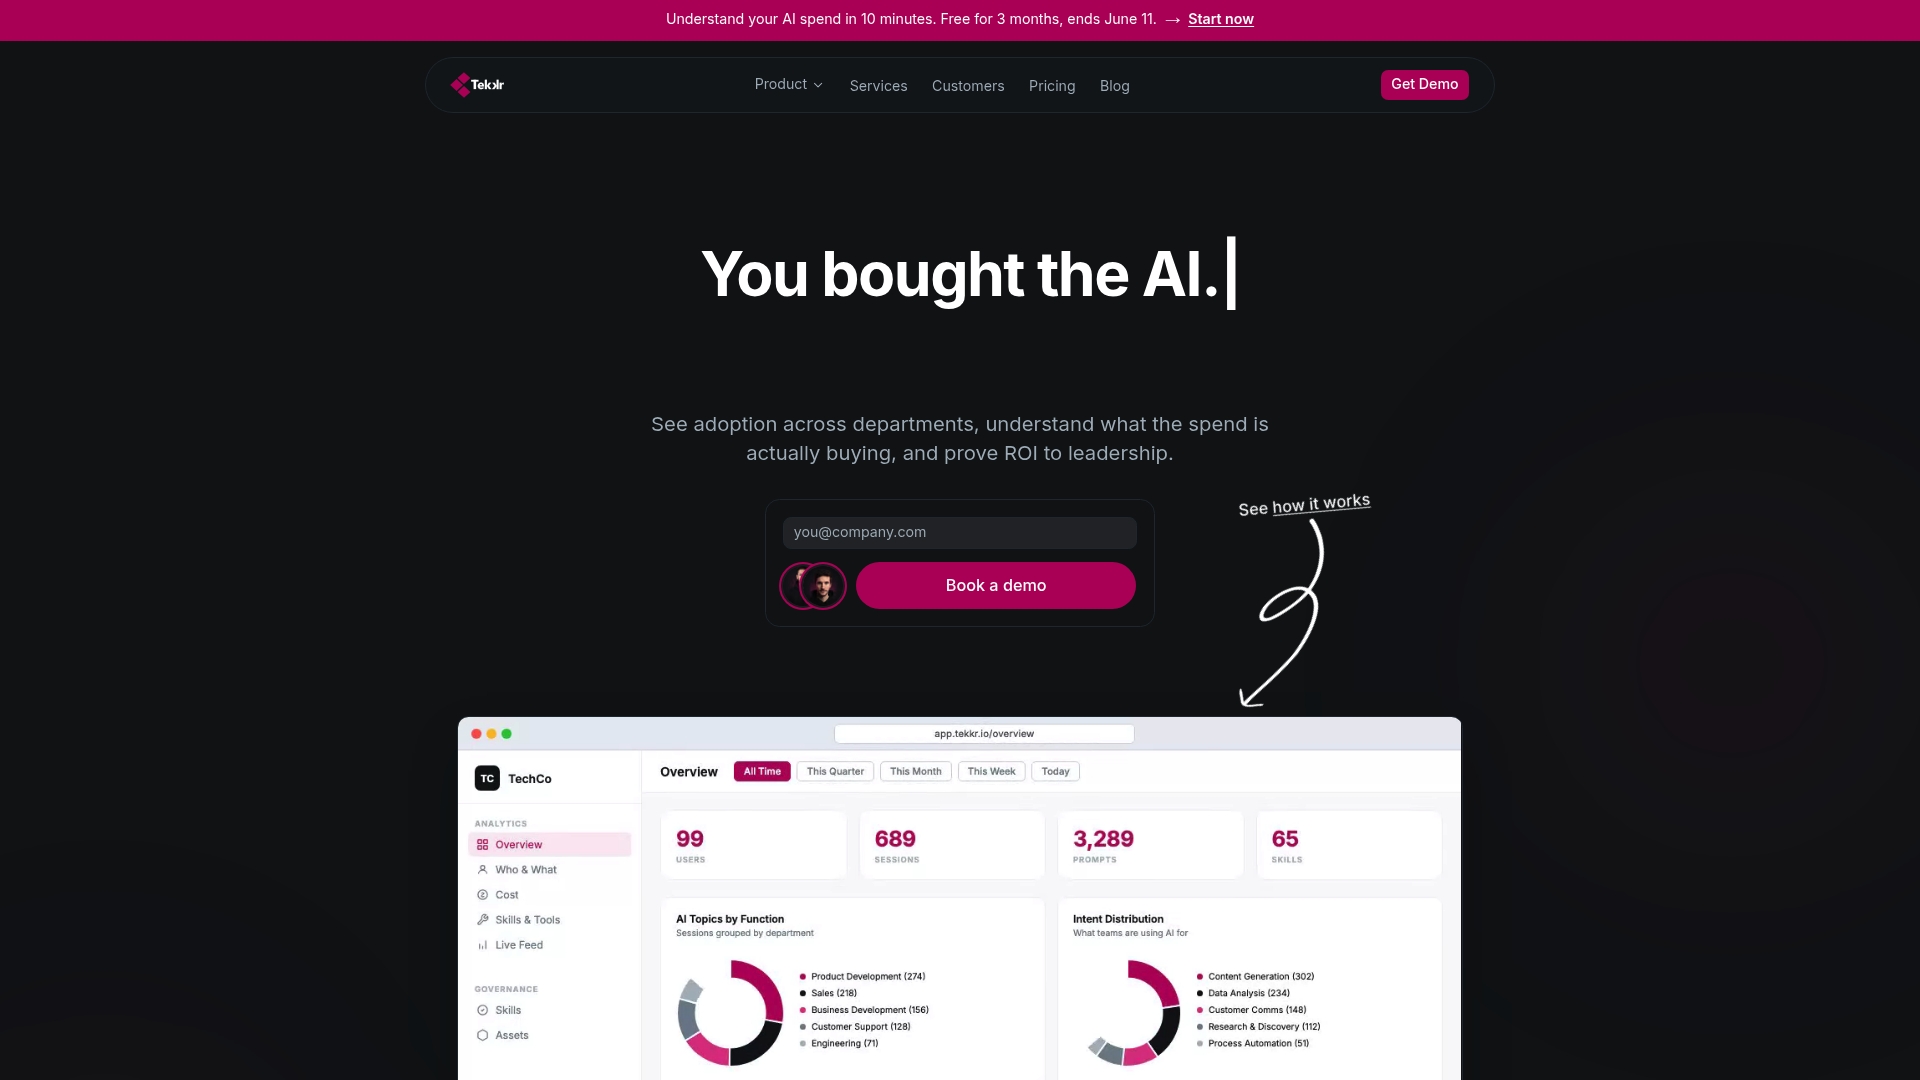
Tekkr’s Configurato is built for exactly that problem. It ingests event-level usage from your existing AI tools, maps spend to cost centers without browser extensions or IT-heavy setup, and generates the executive dashboards your CFO actually wants to see. PII stripping happens at the point of collection. Setup takes about 10 minutes. There’s a free tier with no credit card required.
If your organization is past the “we bought licenses” stage and needs to show measurable ROI, see what Configurato tracks and how it reports to get started.
Sources
- Monitoring AI adoption in the U.S. economy
- Dun & Bradstreet’s AI Momentum Survey of 10,000 Businesses Finds Enterprise AI Returns Continue to Advance, But Only 6% Have the Data Ready to Scale Them
- US state of GenAI Q4 (Deloitte)
- From GenAI ambition to enterprise value | BCG
- Top 5 tips for measuring the productivity of people using GenAI | IBM