
Cost per use case is the driver-based allocation of every AI cost category, from inference to governance, to a single named application, expressed as a dollar figure per business outcome rather than per token. A defensible number rolls up all seven enterprise AI TCO categories and maps each to a real consumption driver. Platforms like Tekkr’s Configurato exist specifically to automate that mapping instead of leaving finance teams to reconstruct it from vendor invoices every quarter.
TL;DR:
- Cost per use case must include all seven enterprise AI TCO categories, such as data foundation, integration, governance, and maintenance, not just inference costs.
- Building a defensible cost model requires detailed artifacts like NPV, payback estimates, and driver-tree documentation, based on a three to six-month ledger trend.
- Shared infrastructure costs should be allocated activity-based, considering each use case’s actual resource consumption rather than even splits.
- Most enterprise AI cost models fail because they rely on vendor invoices or incomplete data, neglect baseline measurements and probabilistic forecasting.
- Automating instrumentation with platforms like Tekkr’s Configurato accelerates accurate, ongoing cost tracking, and supports a trustworthy, audit-ready financial analysis.
Table of Contents
- What Does Cost Per Use Case Actually Measure?
- The Seven Cost Categories You Must Include
- How Do You Calculate Cost Per Use Case Step by Step?
- Building an Implementation Calendar That Finance Trusts
- What Do Auditors Expect From Your Cost Model?
- Handling Shared Costs Across Overlapping Use Cases
- Real-World Patterns in Cost-Per-Use-Case Calculations
- Where Cost-Per-Use-Case Models Go Wrong
- Turning Cost-Per-Use-Case Data Into Ongoing Optimization
- Why Most Cost Models Fail Before They Start
- Getting a Real Cost-Per-Use-Case Number Without Building It by Hand
- Sources
What Does Cost Per Use Case Actually Measure?
Boards and audit committees have stopped accepting cost-per-token as evidence that an AI investment is working. It’s a vendor metric, not a business metric, and it tells you nothing about whether the ticket-resolution bot or the code-review assistant is actually paying for itself. What they want instead is a workload-specific number like $/resolved-ticket or $/merged-pull-request, something that maps directly to a line on the P&L.
That shift matters because the alternative is dangerously misleading. Enterprises that price AI initiatives off vendor-quoted model costs alone routinely understate total cost of ownership by a wide margin. Direct inference typically makes up only 18 to 22 percent of total AI TCO, with data foundation and integration work combined often exceeding 40%. If your cost-per-use-case model only counts the OpenAI or Anthropic invoice, you’re looking at roughly a fifth of the real picture.
Getting this right also means preparing the artifacts finance actually asks for, not just a spreadsheet of usage stats. Expect to produce:
- A net present value (NPV) calculation using a defensible discount rate
- A payback period estimate tied to realistic adoption curves
- A contingency line covering forecast uncertainty and model-mix shifts
- A driver-tree workpaper showing how costs map to the use case, not just to a department
Skip any of these and the number gets challenged in the first budget review, which defeats the entire point of building it.
The Seven Cost Categories You Must Include
A cost-per-use-case figure built from partial data is worse than no figure at all, because it creates false confidence. The seven-category TCO model that survives audit scrutiny looks like this:
- Direct inference and licensing. API calls, token consumption, per-seat subscription fees for tools like Claude or Codex. This is the easiest line to pull and the one most teams stop at.
- Data foundation. Cleaning, labeling, vector database storage, embedding refreshes, and the pipelines that keep retrieval-augmented systems current. Storage sprawl hides here, especially when teams spin up duplicate vector indexes per environment.
- Integration and engineering. Internal engineering hours spent wiring the use case into existing systems, building custom connectors, and maintaining API gateways. Pull this from engineering time-tracking or sprint allocation, not guesswork.
- Evaluation and observability. Tooling and headcount for prompt testing, output quality scoring, and drift monitoring. Often billed to a shared platform team and never allocated back to individual use cases.
- Governance and compliance. Legal review, security audits, model risk assessments, and the compliance tooling required for regulated workflows.
- Change management and training. Enablement programs, documentation, and the productivity dip during rollout. Almost always underbudgeted because it’s not a line item on any vendor invoice.
- Maintenance and migrations. Model version upgrades, re-tuning after a provider deprecates an endpoint, and the periodic re-platforming that every AI stack eventually requires.
Cross-region data transfer fees and idle reserved compute are the two costs that hide most effectively across these categories. Pull vendor quotes for category one, ledger entries for categories two and six, and engineering time estimates for three, four, and seven. No single data source covers all seven, which is exactly why so many organizations settle for the incomplete number.
How Do You Calculate Cost Per Use Case Step by Step?
Start by mapping each cost pool to an allocation driver, the unit of consumption that fairly distributes shared cost. Usage-based drivers (API calls, tokens processed) fit inference costs well. Transaction-based drivers (documents processed, tickets closed) fit data and integration costs. Headcount-based drivers fit governance and training, since those costs scale with the number of people touched by the rollout, not the volume of AI calls.
The calculation itself follows a repeatable sequence:
- Sum total cost per category across the seven lines for the reporting period
- Determine each use case’s share of the driver (for example, its percentage of total API calls or total tickets processed)
- Multiply each cost category by that share to get the use case’s allocated cost
- Divide the allocated total by the count of business outcomes (tickets resolved, documents processed) to get $/outcome
- Roll the annual allocated cost into an NPV calculation against the value delivered, then solve for payback month
A quick sketch: a customer support use case with $340,000 in allocated annual cost across all seven categories, resolving 68,000 tickets, lands at $5 per resolved ticket. Compare that against the fully loaded cost of a human agent handling the same ticket type, and the payback math writes itself.
Statistic Callout: Enterprise AI initiatives typically reach payback between month 14 and month 28, and year-one costs run roughly 60% above year-three steady state once integration and change management work tapers off. Build your contingency assumptions around that curve, not around vendor sales projections that assume instant efficiency.
Building an Implementation Calendar That Finance Trusts
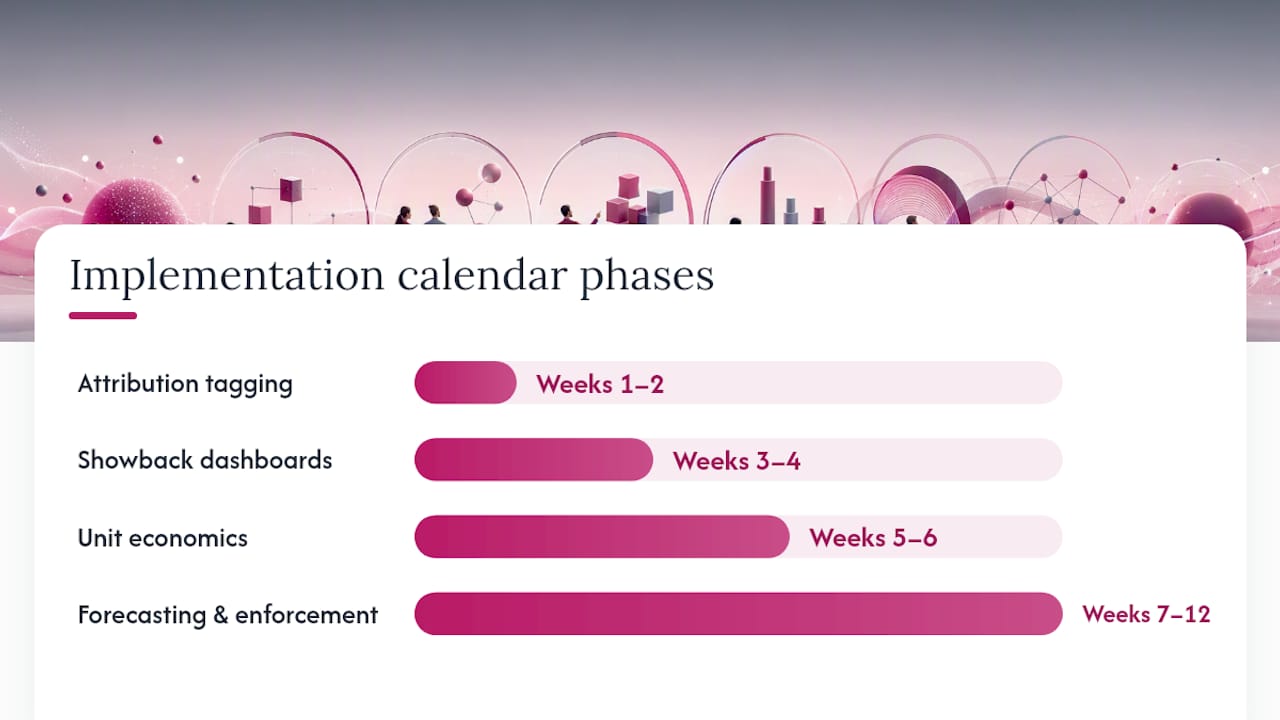
A credible cost-per-use-case program doesn’t happen in a single sprint. It follows a rollout sequence that most FinOps teams converge on independently, because the dependencies force the order:
- Weeks 1 to 2: Implement attribution through gateway tagging, so every API call and prompt carries a use-case identifier before you try to allocate anything.
- Weeks 3 to 4: Stand up showback dashboards so team leads can see their own consumption, even before chargeback billing exists.
- Weeks 5 to 6: Instrument unit economics, connecting consumption data to business outcomes like tickets resolved or documents processed.
- Weeks 7 to 12: Layer in forecasting and enforcement, including budget ceilings and anomaly alerts.
Forecasting works best against percentile distributions rather than averages, since AI usage is heavy-tailed. Size operating budgets to the P90 consumption level, and set a hard ceiling near P99 so a single runaway workflow doesn’t blow the quarter. Layer in adoption-growth multipliers and expected model-mix shifts, since teams that start on a budget-tier model often migrate to a frontier model once they trust the output.
Cheap-first routing is the single highest-leverage lever available here. A classifier that sends the bulk of queries, often 85% or more, to a lower-cost model and reserves frontier models for genuinely complex requests can cut blended LLM costs by 60 to 90%. Pair that with per-API-key hard ceilings and automated anomaly detection to catch a misconfigured agent looping on retries before it appears on the monthly bill.
Pro Tip: Start with showback before you ever attempt chargeback. Teams accept cost visibility far more readily than they accept a bill, and showback data gives you the baseline you need to make chargeback numbers defensible later.
What Do Auditors Expect From Your Cost Model?
Every defensible cost-per-use-case figure starts with a pre-program baseline, not a post-launch estimate. That baseline should tie directly to general ledger entries and cover three to six months of trend data, because a single month can be skewed by a one-time migration cost or an unusually light usage period. A driver-tree methodology documented per business unit is what lets finance aggregate individual use-case numbers into a company-wide figure without double-counting shared infrastructure.
Auditors will also expect you to distinguish hard savings from soft, forward-looking value. That means:
- Applying confidence-tiered haircuts to indirect or optional benefits (a 20 to 40% discount on projected productivity gains is common practice)
- Presenting a sensitivity analysis showing how the NPV shifts under conservative, base, and aggressive adoption scenarios
- Using a discount rate consistent with the company’s existing capital project standards, typically in the 8 to 12% range for enterprise technology investments
- Setting contingency at 15 to 20% of projected cost to absorb forecast error, in line with the cost-overrun pattern the seven-category TCO research documents
None of this is optional if you want the number to survive a quarterly business review, let alone an external audit.
Handling Shared Costs Across Overlapping Use Cases
Most enterprises run several AI use cases on shared infrastructure: a common vector database, a shared prompt-evaluation pipeline, or a single API gateway serving five different applications. Allocating those shared costs cleanly is where most cost-per-use-case models fall apart, because the temptation is to split everything evenly and call it fair.
Even splits are rarely accurate. A customer-support use case that runs constant, low-complexity queries against a shared vector database consumes storage and compute very differently than a legal-research use case running occasional, token-heavy retrieval. The better approach is activity-based apportionment: measure each use case’s actual share of the shared resource, whether that’s query volume, storage footprint, or compute-hours, and allocate the shared cost pool proportionally.
For interdependent applications, where one use case’s output feeds another (a document-classification model that routes work to a downstream drafting assistant, for example), track the handoff explicitly. Treat the downstream use case’s consumption of upstream output as its own driver, so you’re not double-counting the classification cost inside both use cases’ totals. This is also where governance and evaluation costs tend to get muddled, since a single observability platform often monitors multiple use cases at once. Allocate that platform cost by the number of monitored workflows or by relative query volume, and document the method in your driver tree so finance can trace exactly how the shared number was split. Consistency in method matters more than precision in any single allocation.
Real-World Patterns in Cost-Per-Use-Case Calculations
Consider a mid-size financial services firm rolling out an AI-assisted document review tool for loan underwriting. Before instrumentation, the team quoted the initiative’s cost as roughly $80,000 a year, based purely on the vendor’s per-seat license. Once they built out the full seven-category model, allocated integration engineering hours, and captured the governance review required for a regulated workflow, the real annual cost came in closer to $310,000, a gap consistent with the pattern where inference is only 18 to 22 percent of true TCO.
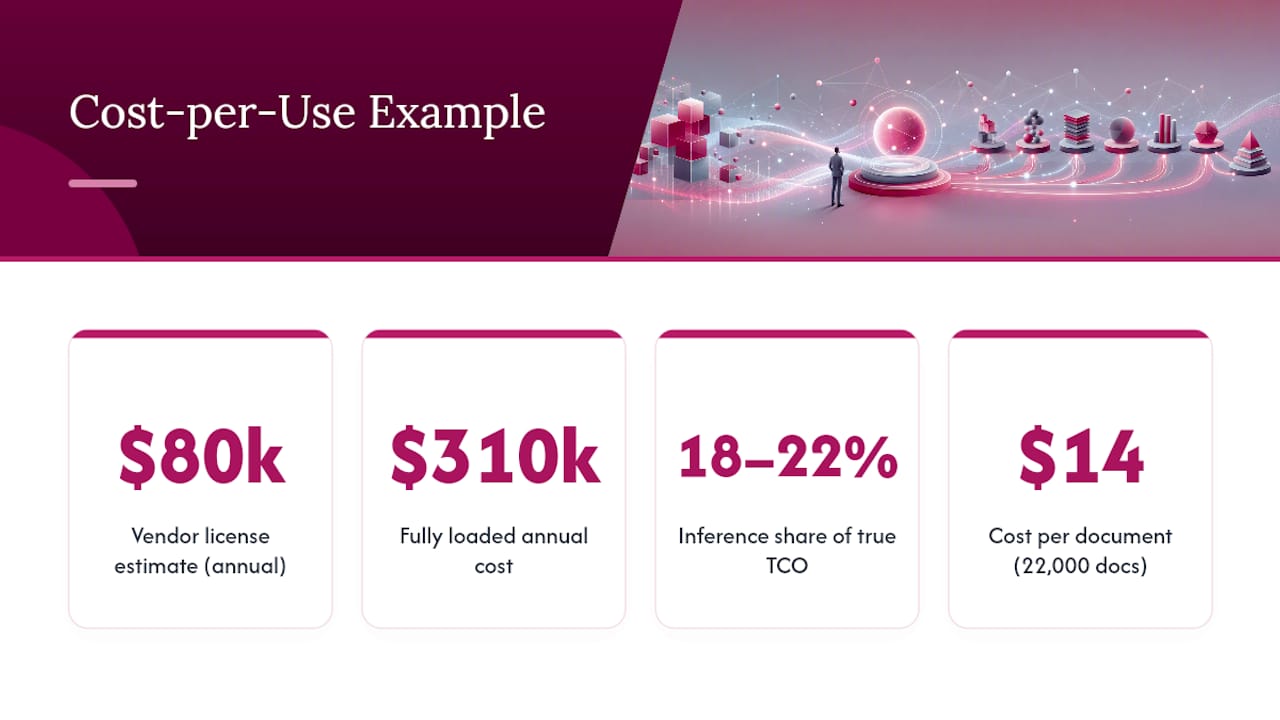
The corrected number changed the decision. At $80,000, the tool looked like an easy win. At $310,000 divided across 22,000 documents reviewed annually, the cost landed at roughly $14 per document, still well below the fully loaded cost of manual review, but tight enough that the team renegotiated the vendor’s per-seat pricing and moved routine document types to a cheaper model tier.
A second pattern shows up repeatedly in customer support deployments. Teams that instrument $/resolved-ticket early tend to catch “forever pilots”, use cases that never graduate past a small test group because nobody can prove the economics. Tracking cost per outcome from week one, rather than waiting for a formal ROI review months later, gives transformation owners the evidence to either scale a pilot with confidence or kill it before it consumes another budget cycle. That keep-or-stop decision is exactly what a clean cost-per-use-case measurement is supposed to enable.
Where Cost-Per-Use-Case Models Go Wrong
The most common error is scoping the calculation to whatever data is easiest to pull, usually the vendor invoice, and calling it done.
A second frequent mistake is allocating shared infrastructure costs with a flat, even split across every use case that touches it, regardless of actual consumption. This systematically overcharges light users of a shared resource and undercharges heavy ones, which distorts every downstream $/outcome figure built on top of it.
Teams also tend to skip the baseline entirely, measuring cost only after launch and comparing it to nothing. Without a pre-program baseline tied to actual ledger data, you have no way to prove the AI use case created value rather than simply shifting cost from one line to another. Related to this is the habit of treating forecasts as fixed rather than probabilistic. A single-point cost estimate, rather than a P50/P90/P99 range, leaves no room for the heavy-tailed usage spikes that FinOps practitioners routinely observe in production AI systems.
The fix for all four is procedural, not technical: mandate the seven-category checklist for every new use case, require activity-based allocation for shared costs, insist on a three-to-six-month baseline before any ROI claim, and forecast in ranges. None of these require new tooling, just discipline in how the existing numbers get assembled.
Turning Cost-Per-Use-Case Data Into Ongoing Optimization
A cost-per-use-case figure that sits in a quarterly slide deck and never changes anything isn’t doing its job. The real value comes from treating the number as a live signal that triggers specific actions, not a retrospective report card.
When a use case’s $/outcome climbs quarter over quarter without a corresponding rise in output quality, that’s the trigger to revisit model mix. Routing a larger share of queries to a budget-tier model, or renegotiating volume pricing once usage crosses a threshold, are both actions the data should prompt automatically rather than waiting for someone to notice during a budget cycle. Enterprises that build cheap-first routing as a default rather than a one-time optimization project tend to hold blended costs flat even as usage volume grows.
The governance share of AI budgets is also rising, now sitting at roughly 8 to 12 percent of total AI spend as organizations scale past pilot phases. That’s a planning signal worth building into next year’s contingency line rather than treating as a surprise. Similarly, the talent-to-software ratio of roughly 1.2x correlates with successful deployments, which means a cost-per-use-case model showing software spend far outpacing enablement headcount is flagging an adoption risk, not just a budget line.
Review cadence matters too. Monthly showback reviews catch drift early; quarterly deep dives are where you revisit driver assumptions and re-baseline against updated ledger data.
Why Most Cost Models Fail Before They Start
Here’s the uncomfortable truth about most enterprise AI cost tracking: it’s built to justify a decision that’s already been made, not to inform the next one. Teams build the cost-per-use-case model after they’ve already committed budget, then work backward to make the number look reasonable. That’s not measurement, it’s storytelling with a spreadsheet attached.
The organizations getting this right treat cost-per-use-case as a pre-commitment tool as much as a post-launch report. They build the driver tree before the pilot starts, so the baseline exists before anyone has an incentive to shape it. That single sequencing choice, baseline first, launch second, is the difference between a number finance trusts and a number finance quietly ignores.
There’s also a tendency to treat this as purely a finance exercise, handed to accounting once the engineering team has moved on. That’s backward. The engineers who built the integration know exactly where the hidden costs live, the cross-region transfer fees, the idle reserved instances, the retry loops nobody noticed. A cost model built without their input misses category two and three almost every time, which is precisely where the biggest gaps between quoted and actual TCO tend to show up. Get engineering and finance building the driver tree together, from week one, and the resulting number holds up under pressure instead of collapsing under the first hard question from the board.
— TekkrTools
Getting a Real Cost-Per-Use-Case Number Without Building It by Hand
Most of the work described above, gateway tagging, driver-tree mapping, showback dashboards, P90 forecasting, is exactly the kind of instrumentation that takes a dedicated team months to build manually and even longer to keep accurate as usage shifts.
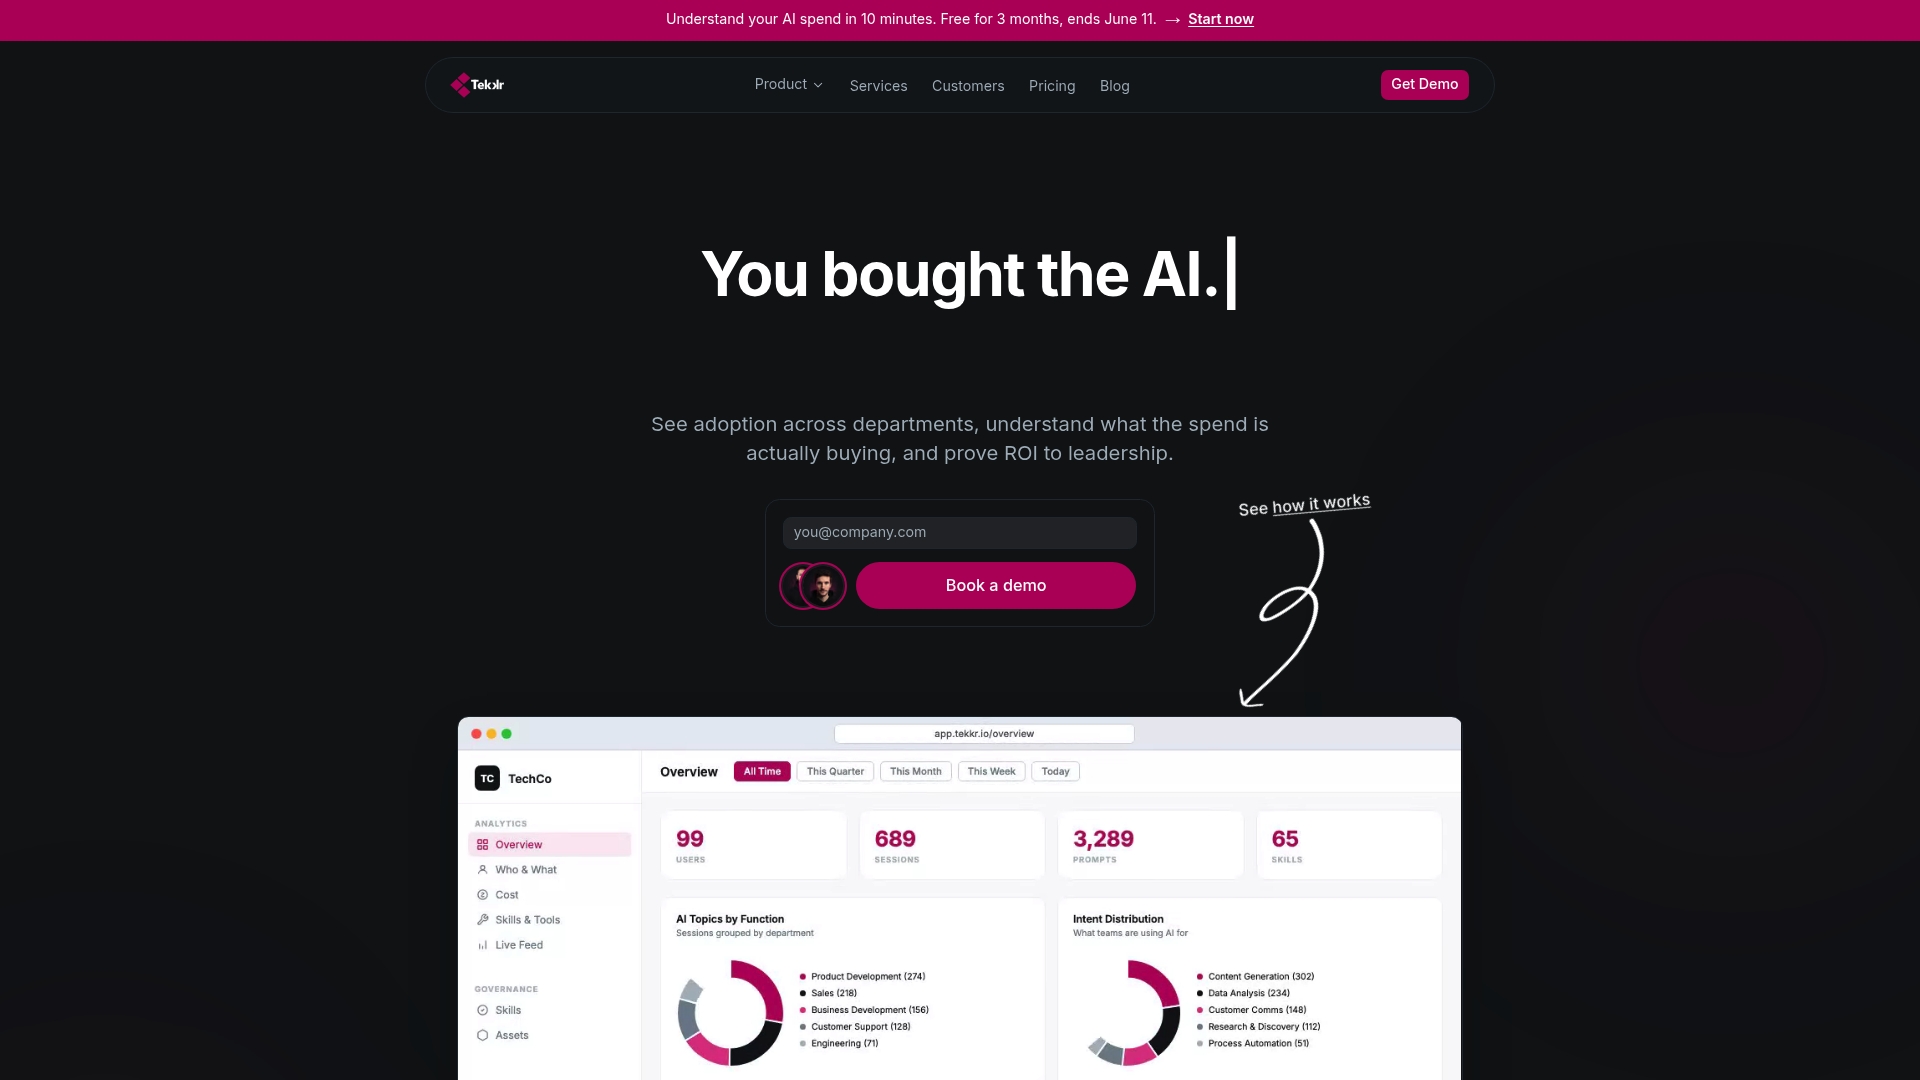
Tekkr’s Configurato platform automates that instrumentation directly. It tracks who’s actually using tools like Claude and Codex across the organization, breaks down spend by team and by use case, and surfaces the driver-level detail finance needs for a defensible allocation, without requiring browser extensions or exposing employee prompts. Every prompt is stripped of personally identifiable information automatically, and the architecture runs end-to-end encrypted and GDPR-compliant, so adoption data never becomes a governance liability. Setup runs about ten minutes on the free tier, no credit card required, which means you can start capturing the baseline this framework calls for immediately rather than waiting on a procurement cycle. For organizations that want hands-on help building the driver tree and rollout calendar, Tekkr also offers consulting for the full transformation. If you’re ready to see where your own use-case costs actually live, explore Tekkr’s AI adoption solution and start the baseline you’ll need for next quarter’s review.
Sources
- AI ROI Measurement for Enterprise: The 2026 Business Case Framework for GenAI - Sthambh
- AI FinOps: A Token Budgeting and Chargeback Framework - Particula
- Enterprise AI ROI Assessment: Methodology Guide 2026 - Supalabs
- Enterprise AI Budget Allocation 2026: Where the Spend Actually Goes | Presenc AI