
Automated AI reporting is the practice of using connected data pipelines and AI models to generate, update, and distribute business reports without manual assembly. The single best starting step is narrow: pick one or two KPIs that matter to a real decision, then instrument the data sources behind them. Done right, this approach saves hours of manual work each week and produces insights that are more consistent and timelier than spreadsheet-built reports.
TL;DR:
- Automation is most cost-effective for recurring reports with structured, accessible data and a clear decision-making KPI.
- Risks primarily stem from weak data governance, insufficient access controls, and untracked shadow AI use, which can lead to data leaks and security breaches.
- A 30-day pilot should focus on adoption, spend visibility, and one actionable time-savings metric, with implementation steps including KPI definition and data source inventory.
- Proper governance requires maintaining an inventory of data sources, applying role-based access, implementing TEVV, and having an incident response plan before scaling.
- Key metrics to prove ROI include data freshness, delivery success, report adoption, model accuracy, and drift detection, tracked at operational, business, and AI levels.
Table of Contents
- What automated AI reporting is and how it differs from manual reporting
- Automated reporting vs manual reporting: benefits, limits, and decision checklist
- Common failure modes and risks: data governance, shadow AI, PII, and access controls
- Practical implementation workflow: step-by-step to build automated AI reporting
- KPIs and metrics to track to prove value from automated AI reporting
- Governance and controls: applying NIST AI RMF functions to automated reporting pipelines
- Practitioner example: a 30-day observability pilot and where Tekkr fits
- Author perspective: human-in-the-loop and change management considerations
- How Tekkr helps with observability, adoption, and fast pilots
- FAQ
- Sources
What automated AI reporting is and how it differs from manual reporting
Automated AI reporting connects five layers that normally sit apart in a manual process: data connectors, an extraction and transformation stage, an analysis or model layer, a templating engine, and a delivery mechanism. Data flows in from source systems, gets cleaned and standardized, passes through rules-based logic or a model that generates insights, gets formatted into a narrative or dashboard, and lands in an inbox, Slack channel, or BI tool on a schedule.
Manual reporting, by contrast, depends on someone pulling data from multiple tools, reconciling it by hand, and writing commentary before every meeting. That works fine for a single quarterly deck. It breaks down the moment an organization needs the same report produced weekly for ten departments, each with its own data quirks and deadline.
The practical differences show up in three places:
- Scale: a manual process that takes two hours for one team takes the same two hours for the tenth team, while an automated pipeline adds marginal cost closer to zero once it is built.
- Repeatability: automated pipelines apply the same transformation logic every run, removing the version-control drift that creeps into hand-built spreadsheets.
- Insight generation: a model layer can flag anomalies or summarize trends in plain language, something a manual process only does when someone has time to dig.
A finance team tracking AI tool spend across departments is a common use case: connectors pull usage and billing data, a model layer flags departments with unusual cost spikes, and a templated narrative goes to the CFO every Monday morning. A product team monitoring feature adoption after a release is another: the same architecture, different KPIs, same underlying logic.
Automated reporting vs manual reporting: benefits, limits, and decision checklist
Automation earns its keep fastest where a report repeats on a schedule and feeds a recurring decision. Teams that automate recurring reports typically reclaim hours previously spent on data pulls and formatting, since the practice of automated reporting is built specifically to cut repetitive assembly work and let people spend that time on interpretation instead. Consistency is the other clear win: a pipeline applies the same logic every time, so two reports from different weeks are actually comparable.
Manual work still wins in a few specific situations. A one-off investigation into a single anomaly rarely justifies building a pipeline. Exploratory analysis, where the questions change as you go, is still better served by a person with a notebook and a query tool than by a rigid templated system. And any report that depends on judgment calls a model cannot make, like interpreting a sensitive personnel issue, belongs with a human from the start.
Automation also carries overhead that is easy to underestimate: integration work to connect every data source cleanly, ongoing maintenance as upstream systems change their schemas, and governance work to keep the pipeline compliant and auditable, including AI compliance automation capabilities that help risk and compliance teams manage controls effectively. None of this is a reason to avoid automation. It is a reason to plan for it before the first pilot launches.
Before committing to a full build, run through this checklist:
- Does the report repeat on a fixed cadence? If it runs weekly or monthly for the same audience, automation pays off quickly.
- Is the underlying data already structured and accessible? Pipelines need clean, queryable sources, not scattered spreadsheets.
- Can you define success with one or two KPIs? A report without a clear metric is hard to automate and harder to validate.
- Do you have a governance plan for sensitive data? If the report touches PII or regulated information, build the controls before the pipeline, not after.
Answering yes to all four is a reasonable signal to move forward with a pilot rather than a full rollout.
Common failure modes and risks: data governance, shadow AI, PII, and access controls
The most frequent point of failure in automated reporting projects is not the model. It is data governance, and the gap is wider than most teams expect.
A majority of organizations lacked AI governance policies at the time of the IBM Cost of a Data Breach report, and nearly all organizations that experienced AI-linked security incidents lacked proper AI access controls. That combination, weak governance plus weak access controls, is what turns a reporting pipeline into a liability rather than an asset.
Shadow AI compounds the risk. When employees feed sensitive data into unsanctioned AI tools outside any approved pipeline, that data can leak without anyone in security or compliance ever knowing it happened. An automated reporting project that does not account for shadow AI is solving half the problem.
A few mitigations address most of this risk directly:
- Inventory every system that touches the report, including any tool an employee might use informally to shortcut analysis.
- Strip PII automatically at the ingestion layer rather than relying on someone to remember to redact it later.
- Apply role-based access controls so only people who need a given report’s underlying data can query it.
- Run TEVV (test, evaluation, validation, verification) on any model output before it reaches an executive audience, with documented acceptance criteria.
Before automating a single report, confirm five things: data sources are inventoried, PII stripping runs automatically, access controls match job function, model outputs go through TEVV, and an incident response plan exists for the day something still goes wrong. Skipping any one of these is how a time-saving pipeline becomes the subject of a postmortem.
Practical implementation workflow: step-by-step to build automated AI reporting
Building automated AI reporting is a sequence, not a single project. Each step below produces something concrete before you move to the next.
- Define the audience and one to three KPIs. Decide who reads the report and what decision it enables. A report with no decision attached to it will not survive its first budget review.
- Inventory and instrument data sources. List every system the report touches, confirm API or connector availability, and set up the telemetry needed to pull data reliably on schedule. Our data lake guidance walks through this step in more depth.
- Build ETL with quality controls. Add schema checks, data lineage tracking, and sampling validation so a broken upstream field does not silently corrupt a report.
- Choose the analysis layer and validate it. Decide whether rules-based logic, a traditional ML model, or an LLM prompt best fits the task, then test each against known-good outputs before trusting it with live data.
- Template the narrative. Structure the executive summary so it leads with the decision-relevant number, then supports it with context. Our examples of board-level reporting show what this looks like in practice.
- Set up delivery, scheduling, and feedback loops. Automate distribution to the right channel on the right cadence, and build in a way for recipients to flag errors or request changes.
Pro Tip: Run your first automated report in parallel with the manual version for two full cycles before retiring the manual process, so you catch discrepancies while you still have a baseline to compare against.
A 30-day pilot is the right scope for a first attempt. Week one covers KPI definition and data source inventory. Weeks two and three cover ETL build-out, model selection, and validation. Week four covers templating, delivery setup, and a review with the report’s actual audience. Build a rollback plan from day one: if data quality issues surface mid-pilot, revert to the manual process for that cycle rather than shipping a report you cannot stand behind.

KPIs and metrics to track to prove value from automated AI reporting
Proving the value of automated reporting means tracking metrics at three levels: operational, business, and AI-specific.
Operational metrics tell you whether the pipeline itself is healthy: data freshness (how current the underlying data is when a report ships), delivery success rate (how often the report arrives on schedule without manual intervention), and report generation time (how long the full pipeline takes end to end).
Business metrics tell you whether the report is actually useful: hours of manual work reclaimed, any measurable productivity or conversion gains tied to faster decisions, and adoption of the report itself, meaning whether the intended audience actually opens and acts on it.
AI-specific metrics matter once a model sits in the analysis layer: accuracy against known-good benchmarks, drift indicators that flag when model behavior shifts from its validated baseline, and TEVV pass rates that track how often outputs clear your validation bar before reaching an audience.
Tracking well-defined KPIs is one of the practices most correlated with realized value from AI investments, ahead of many other factors organizations focus on. Our guide to metrics for AI success breaks down how to pick the right ones for your organization, and our CFO-ready measurement plan covers cadence and reporting structure for a finance audience specifically.
- Executives need a monthly summary focused on business metrics and trend direction.
- Report owners need a weekly operational view to catch pipeline issues early.
- Data and AI teams need continuous visibility into drift and TEVV pass rates to keep the model layer trustworthy.
Governance and controls: applying NIST AI RMF functions to automated reporting pipelines
The NIST AI Risk Management Framework organizes AI governance into four functions, and each maps cleanly onto a reporting pipeline.
GOVERN means establishing who owns the pipeline, what review cadence applies, and maintaining a current inventory of every data source and model involved. Without this, nobody can answer a basic audit question like “what feeds this report” six months after launch.
MAP means documenting data provenance and defining which use cases are acceptable for a given dataset or model. A customer support dataset approved for an internal productivity report is not automatically approved for a report that goes to investors.

MEASURE means running TEVV consistently, tracking validation metrics over time, and bringing in independent review for any report that informs a high-stakes decision. This is where drift gets caught before it reaches an executive’s inbox.
MANAGE means having an incident response plan ready before you need it, vetting any third-party tool or model vendor in the pipeline, and setting clear data retention and traceability rules so you can reconstruct exactly how a given report number was produced.
Applied together, these four functions turn governance from an annual compliance exercise into an operating habit:
- Maintain one inventory covering every data source, model, and connector in the pipeline.
- Document acceptable use cases for each dataset before connecting it to a new report.
- Require independent review and TEVV sign-off before a new report type goes live.
- Keep an incident response plan and vendor diligence checklist on file, not just in theory.
Our governance strategies guide covers how to put these controls into practice without slowing a pilot to a crawl.
Practitioner example: a 30-day observability pilot and where Tekkr fits
A realistic pilot measures three things by day 30: adoption across the pilot cohort, spend visibility by team, and at least one tangible time-savings metric. That scope is deliberately narrow because it is achievable inside a single sprint cycle and gives you real numbers to justify the next phase.
We offer a platform designed for this kind of pilot. It tracks usage of AI tools across an organization, breaks down spend by team, and surfaces use-case intelligence to help leaders see where AI investment is paying off and where it is not. Setup is quick, with no browser extensions required, and the architecture includes end-to-end encryption with automatic PII stripping to help keep pilot data governed from day one.
A sample day-30 report from this kind of pilot typically covers:
- Adoption rate across the pilot cohort, broken down by team or role.
- Spend allocation showing which departments are driving AI tool costs.
- One or two time-savings metrics tied to specific workflows the pilot targeted.
Teams that want a reference point for structuring this kind of pilot can find more detail in our observability and ROI resources.
Author perspective: human-in-the-loop and change management considerations
The temptation with automated reporting is to assume that once a pipeline runs cleanly, oversight can relax. That assumption is where most governance failures start. Human review should stay mandatory anywhere a report touches a regulatory disclosure, a personnel decision, or any output that could materially mislead a reader if a model gets it wrong.
Change management matters as much as the technical build. Start with a small pilot cohort, train that group explicitly on what the automated report does and does not replace, and communicate early that the goal is freeing up analysis time, not eliminating analyst roles. Teams adopt automated reporting faster when they see it as a tool that removes drudgery rather than a system watching over their work.
— TekkrTools
How Tekkr helps with observability, adoption, and fast pilots
Many teams trying to prove AI value end up stitching together spreadsheets from multiple tool dashboards, which is slower and less reliable than a purpose-built pipeline. Our platform is designed to close that gap by measuring AI adoption, spend, and ROI across an organization in one place, with quick setup and an available free tier.
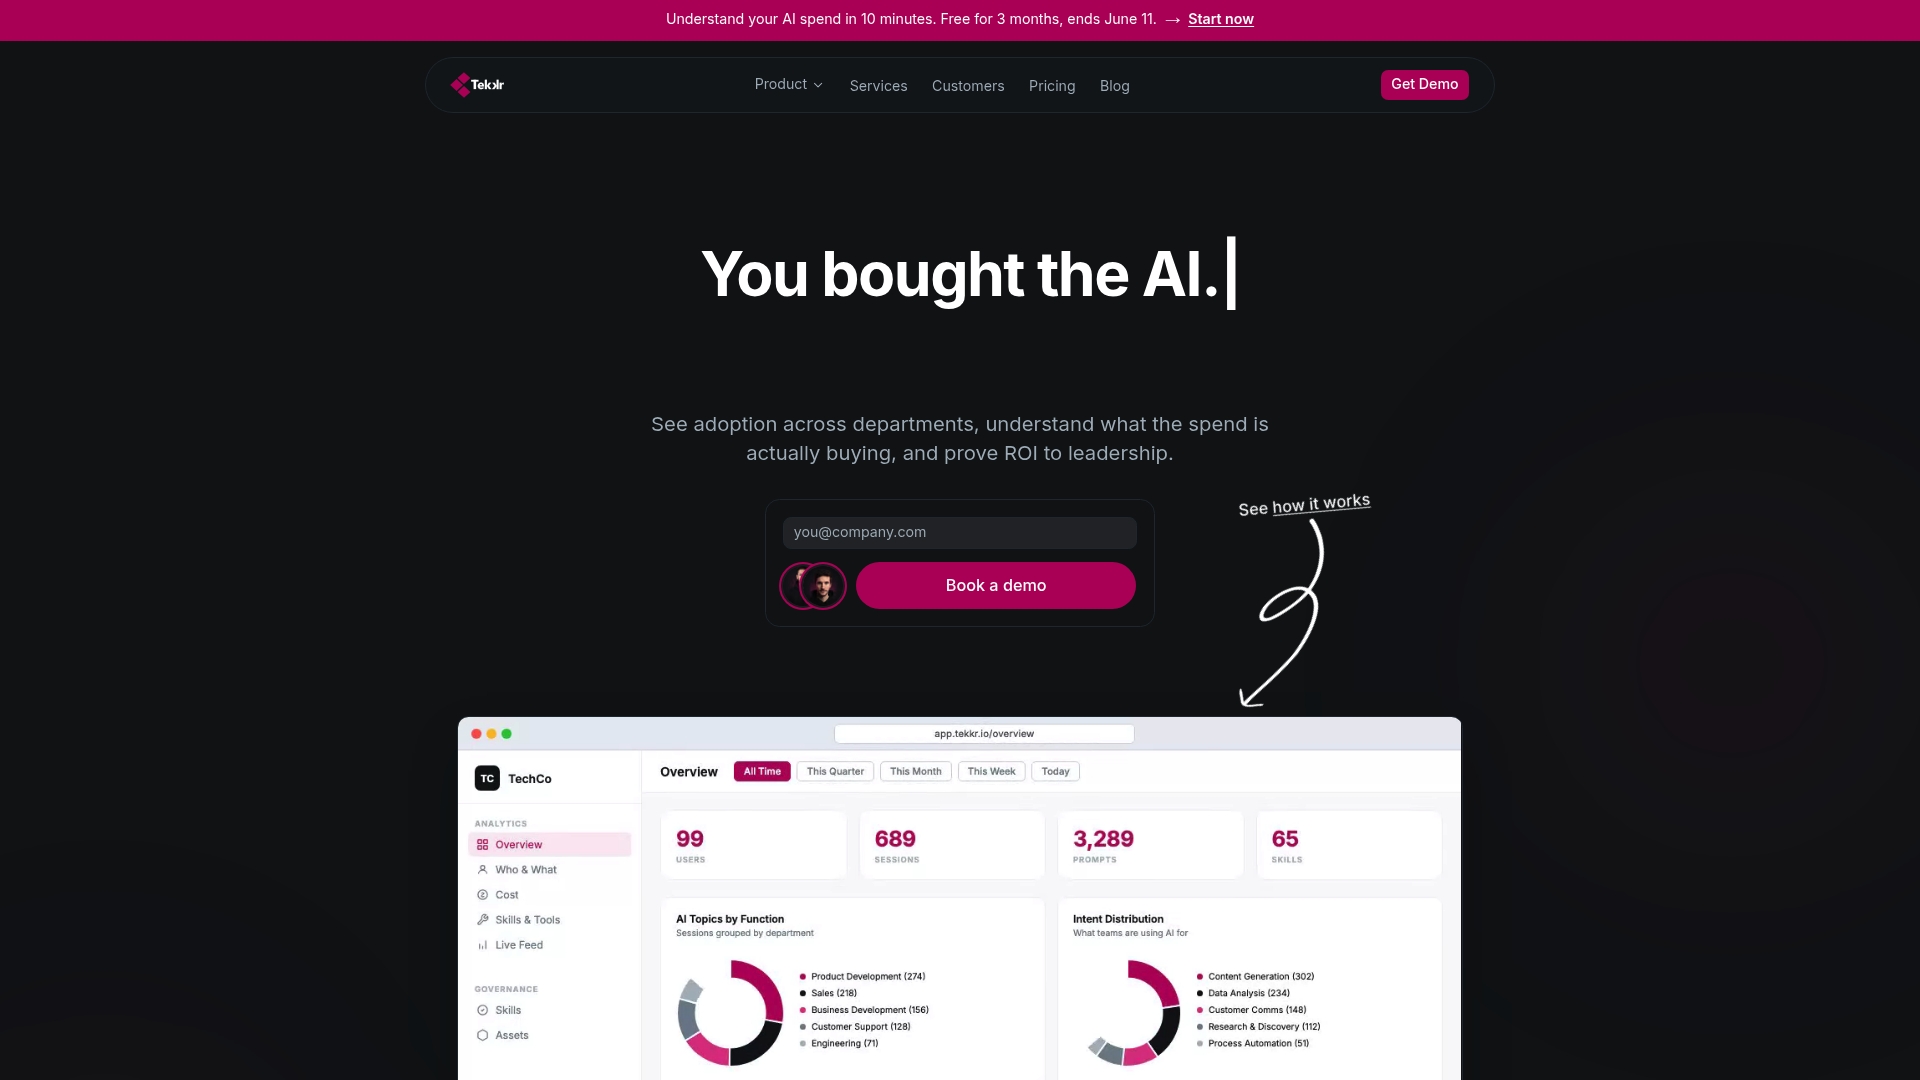
If you are ready to run the kind of 30-day pilot described above, start with our Configurato product page to see what the platform tracks out of the box, or check pricing and plans if you already know you want to move past a pilot. The platform is designed for enterprise and tech teams that need visibility into AI spend and methods to improve adoption across departments.
FAQ
What is automated AI reporting?
Automated AI reporting is the use of connected data pipelines and AI models to generate and distribute reports without manual data pulls or formatting. It typically combines data connectors, an ETL stage, an analysis or model layer, templating, and scheduled delivery into one continuous workflow.
How is automated AI reporting different from a regular BI dashboard?
A standard BI dashboard displays data that someone still has to interpret manually, while automated AI reporting adds a model layer that generates narrative insights, flags anomalies, or summarizes trends in plain language. Most automated reporting pipelines integrate with existing BI tools rather than replacing them, feeding processed insights into the dashboards teams already use.
What is the biggest risk when automating AI reporting?
Weak data governance is the most common point of failure, not the model itself. In IBM’s Cost of a Data Breach research, a majority of organizations lacked AI governance policies, and nearly all organizations that suffered AI-linked incidents lacked proper access controls.
What KPIs should we track to prove ROI from automated reporting?
Track operational metrics like data freshness and delivery success rate, business metrics like time saved and adoption of the report itself, and AI-specific metrics like model accuracy and drift. Well-defined KPIs are one of the practices most correlated with realized AI value in organizations that successfully scale AI.
Can automated AI reporting tools integrate with our existing BI stack?
Yes, most automated reporting pipelines are designed to feed into existing BI and reporting platforms rather than replace them, acting as the data preparation and insight layer upstream. Tools like Tekkr’s Configurato are built to connect with AI assistants and existing systems rather than requiring a separate standalone dashboard.
Sources
- Cost of a Data Breach | IBM
- The state of AI: how organizations are rewiring to capture value | McKinsey
- Artificial Intelligence Risk Management Framework: Generative Artificial Intelligence Profile (NIST)
- Automated reporting vs manual reporting: The showdown