
AI use case analytics means tracking adoption, spend attribution, and return on investment for every AI tool and workflow across an organization. The action for 2026 is narrow: pick 2 to 3 outcome metrics tied to revenue or cost, run one controlled pilot with a real baseline, and use that result to defend or redirect the AI budget. Platforms built for this can compress that process into weeks instead of quarters.
TL;DR:
- Sales conversion lift and collection efficiency are the fastest-moving metrics, typically showing results within 8 to 12 weeks after AI deployment.
- Establishing a baseline before rollout and tagging every request are essential to accurately measure AI’s financial impact and avoid unfalsifiable claims.
- Clear ownership, budget controls, and cost visibility are critical to prevent shadow spending and maximize AI ROI across teams.
- Capturing detailed telemetry at the request level, including user, workflow, and model metadata, ensures accurate attribution and privacy compliance.
- Starting with a single high-impact pilot and disciplined tracking can demonstrate ROI within 30 days, enabling informed budget decisions.
Table of Contents
- What to Measure: The ROI-First Metrics Enterprise Leaders Must Track
- How to Set Up Measurement: Baselines, Pilots, and Attribution Pipelines
- Governance and Finance: Ownership, Budgets, and Cost Policies That Prevent Shadow Spend
- Operationalizing Analytics: What the Tooling Stack Needs to Capture
- The 30-Day Playbook to Prove Return on AI
- Why Outcome Economics Beats Activity Metrics
- Tekkr Configurato: Turn Adoption Data Into a Budget Decision
- Sources
What to Measure: The ROI-First Metrics Enterprise Leaders Must Track
Most AI dashboards track activity: logins, prompts sent, seats licensed. None of that convinces a CFO. Gartner recommends anchoring measurement instead to metrics that tie directly to revenue, cost, or employee experience.
Five metrics belong on every executive scorecard:
- Sales conversion lift — the change in close rate for deals touched by an AI-assisted workflow versus a matched control group.
- Average labor cost per worker — hours reallocated or eliminated per task, multiplied by fully loaded wage cost.
- Time to value — the interval between tool rollout and the first measurable financial or operational gain.
- Collection efficiency index — how AI-assisted processes affect days sales outstanding or dispute resolution time.
- eNPS — employee sentiment toward the tool, since adoption dies quietly when people quietly stop using something they were forced to try.
Sales conversion and collection efficiency tend to show movement in 8 to 12 weeks, according to Gartner’s analysis. eNPS and labor cost shifts take longer because behavior change and org-wide habits lag behind tool access.
The formula matters less than the discipline behind it: measure the metric before rollout, isolate a comparable group that didn’t get the tool, and calculate the delta monthly. The most common trap is measuring only activity, like the number of AI-generated documents, without ever connecting that activity to a dollar figure or a baseline. A close second: launching a pilot with no pre-rollout number to compare against, which makes any post-launch claim unfalsifiable.
How to Set Up Measurement: Baselines, Pilots, and Attribution Pipelines
Building a defensible RoAI case starts before anyone touches a new tool. Follow this sequence:
- Capture a baseline. Record time-to-complete, error and rework rate, volume handled per person, and one downstream business result (revenue, retention, ticket resolution) for the current, non-AI process.
- Design a controlled rollout. Split comparable teams or workflows into a treatment group and a control group, or stagger rollout by cohort. Build a minimum scorecard of 6 to 8 metrics before launch, not after.
- Instrument every request. Tag usage by team, workflow, and model call. Capture token counts and request metadata so spend can be traced back to the workflow that generated it, not just the department that holds the license. CIO reporting found that most organizations can’t trace AI spend to specific teams or workflows at all, which is exactly why optimization efforts stall on the wrong lever, like chasing a cheaper model instead of fixing a wasteful workflow.
- Set a measurement cadence. Check adoption weekly for the first month, efficiency metrics biweekly, and business outcomes monthly once volume is high enough to be statistically meaningful.
IBM recommends exactly this phased approach: baseline, then efficiency, then quality, then downstream outcomes, in that order, so a leader never confuses early enthusiasm with lasting results.
Governance and Finance: Ownership, Budgets, and Cost Policies That Prevent Shadow Spend
Somebody has to own AI spend the way somebody owns cloud infrastructure spend. Without a named owner, cost sprawls across departmental credit cards and shadow subscriptions nobody reconciles.
That owner’s job includes:
- Approving new AI tool purchases and tracking utilization against the business case that justified them.
- Setting model-level spend alerts so a cost spike gets flagged within days, not discovered at quarter close.
- Embedding a cost review into the existing procurement or engineering approval workflow, rather than running it as a separate audit.
- Publishing a monthly dashboard covering spend by team, adoption rate, and at least one financial outcome metric.
KPMG’s Global AI Pulse research found that organizations with clear cost governance are far more likely to report established AI ROI than those without it. Cost visibility and ownership aren’t administrative overhead; they’re the difference between a program finance trusts and one it eventually cuts.
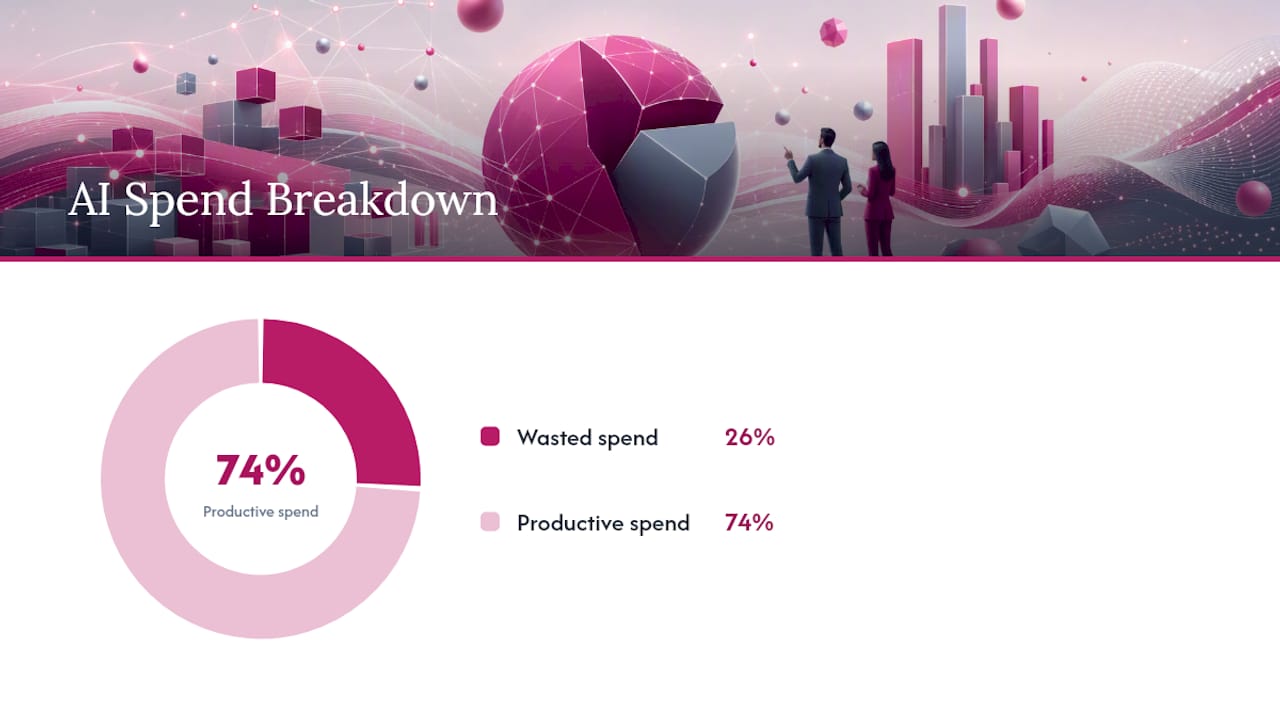
Blunt budget caps, like capping every team’s monthly token spend at a fixed number, tend to backfire because they punish high-value use cases along with wasteful ones. Attribution-first controls work better: retry limits on failed model calls, guardrails on which model tier a workflow can invoke, and per-workflow budgets tied to the outcome that workflow produces. A 2026 Harness report puts estimated wasted AI spend at roughly 26% across enterprises, largely because basic visibility into where money goes is missing before anyone tries to cut it.
Operationalizing Analytics: What the Tooling Stack Needs to Capture
An analytics stack built for use-case visibility needs telemetry at the request level, not just the license level. The minimum set:
- User and team identity mapped to each request.
- Workflow ID, so a single “AI usage” number breaks into the specific processes driving it.
- Model and prompt metadata, including which model handled the call.
- Token counts and cost per call, tied back to the workflow that triggered it.
- Timestamps, so adoption trends and cost spikes can be traced to a specific rollout event.
Capturing that much detail raises an obvious concern: prompt content often contains sensitive business or customer data. Privacy-first architecture answers that concern directly rather than treating it as a tradeoff against visibility. Automatic PII stripping, prompt anonymization, and end-to-end encryption let a platform report on usage patterns and spend without ever storing what an employee actually typed.
Some platforms are built around that pattern. They track who’s actually using tools like Claude and Codex, break spend down by team, and surface use-case intelligence, often without browser extensions and with automatic PII stripping baked into the pipeline. Setup can be quick, and free tiers are sometimes available, allowing finance or product leaders to get first-pass visibility before committing budget to a bigger rollout.
For integration sequencing, connect the finance system first, since that’s where the cost-per-use-case number needs to land. Data warehouse and executive dashboard connections follow once the cost data has somewhere reliable to live.
The 30-Day Playbook to Prove Return on AI
A defensible RoAI story doesn’t require a year-long transformation program. It requires one well-chosen pilot and disciplined tracking.
- Week 0: Pick one high-impact use case with a clear downstream outcome and a real counterfactual, meaning a comparable team or process that isn’t getting the tool yet.
- Week 1: Instrument baseline metrics, tag every request by team and workflow, and build the dashboard before rollout starts, not after.
- Weeks 2 through 4: Run the cohort or A/B rollout. Watch adoption and efficiency signals weekly, and adjust prompts or workflow design as friction shows up, since workflow redesign frequently saves more than switching to a cheaper model.
- Weeks 5 through 8: Measure the downstream outcome, then calculate ROI as change in revenue plus change in gross margin plus avoided cost, minus total cost of ownership. Package it into a short deck for executive review.
Pro Tip: The minimum dataset a CFO will actually accept includes a documented baseline, a clear attribution mapping from spend to workflow, cost per unit of output, the measured change in the downstream outcome, and a full TCO accounting that includes licensing, integration time, and review overhead, not just the subscription line item.
Why Outcome Economics Beats Activity Metrics
Most AI rollouts fail not because the tools don’t work, but because nobody defined what “working” would look like before flipping the switch. Adoption dashboards that stop at login counts and prompt volume feel like progress and measure almost nothing a board will accept as proof.
The organizations getting this right treat AI spend the way they’d treat any capital allocation decision: name an owner, set a baseline, run a controlled comparison, and report the dollar delta. That discipline is what Tekkr’s own work with customers moving from scattered AI experimentation toward accountable spend keeps confirming. The companies that skip attribution end up with AI-driven output invisibly credited to human labor, which makes the entire ROI conversation impossible to have honestly.
Start with one pilot, one owner, and one financial metric. Everything else in an AI analytics program can wait until that first result holds up under scrutiny.
— TekkrTools
Tekkr Configurato: Turn Adoption Data Into a Budget Decision
Tekkr is the practical alternative to guessing at AI ROI from license counts and spreadsheet exports. Configurato tracks who’s actually using tools like Claude and Codex, breaks spending down by team and workflow, and surfaces use-case intelligence so leaders can see which pilots deserve more budget and which quietly stalled.
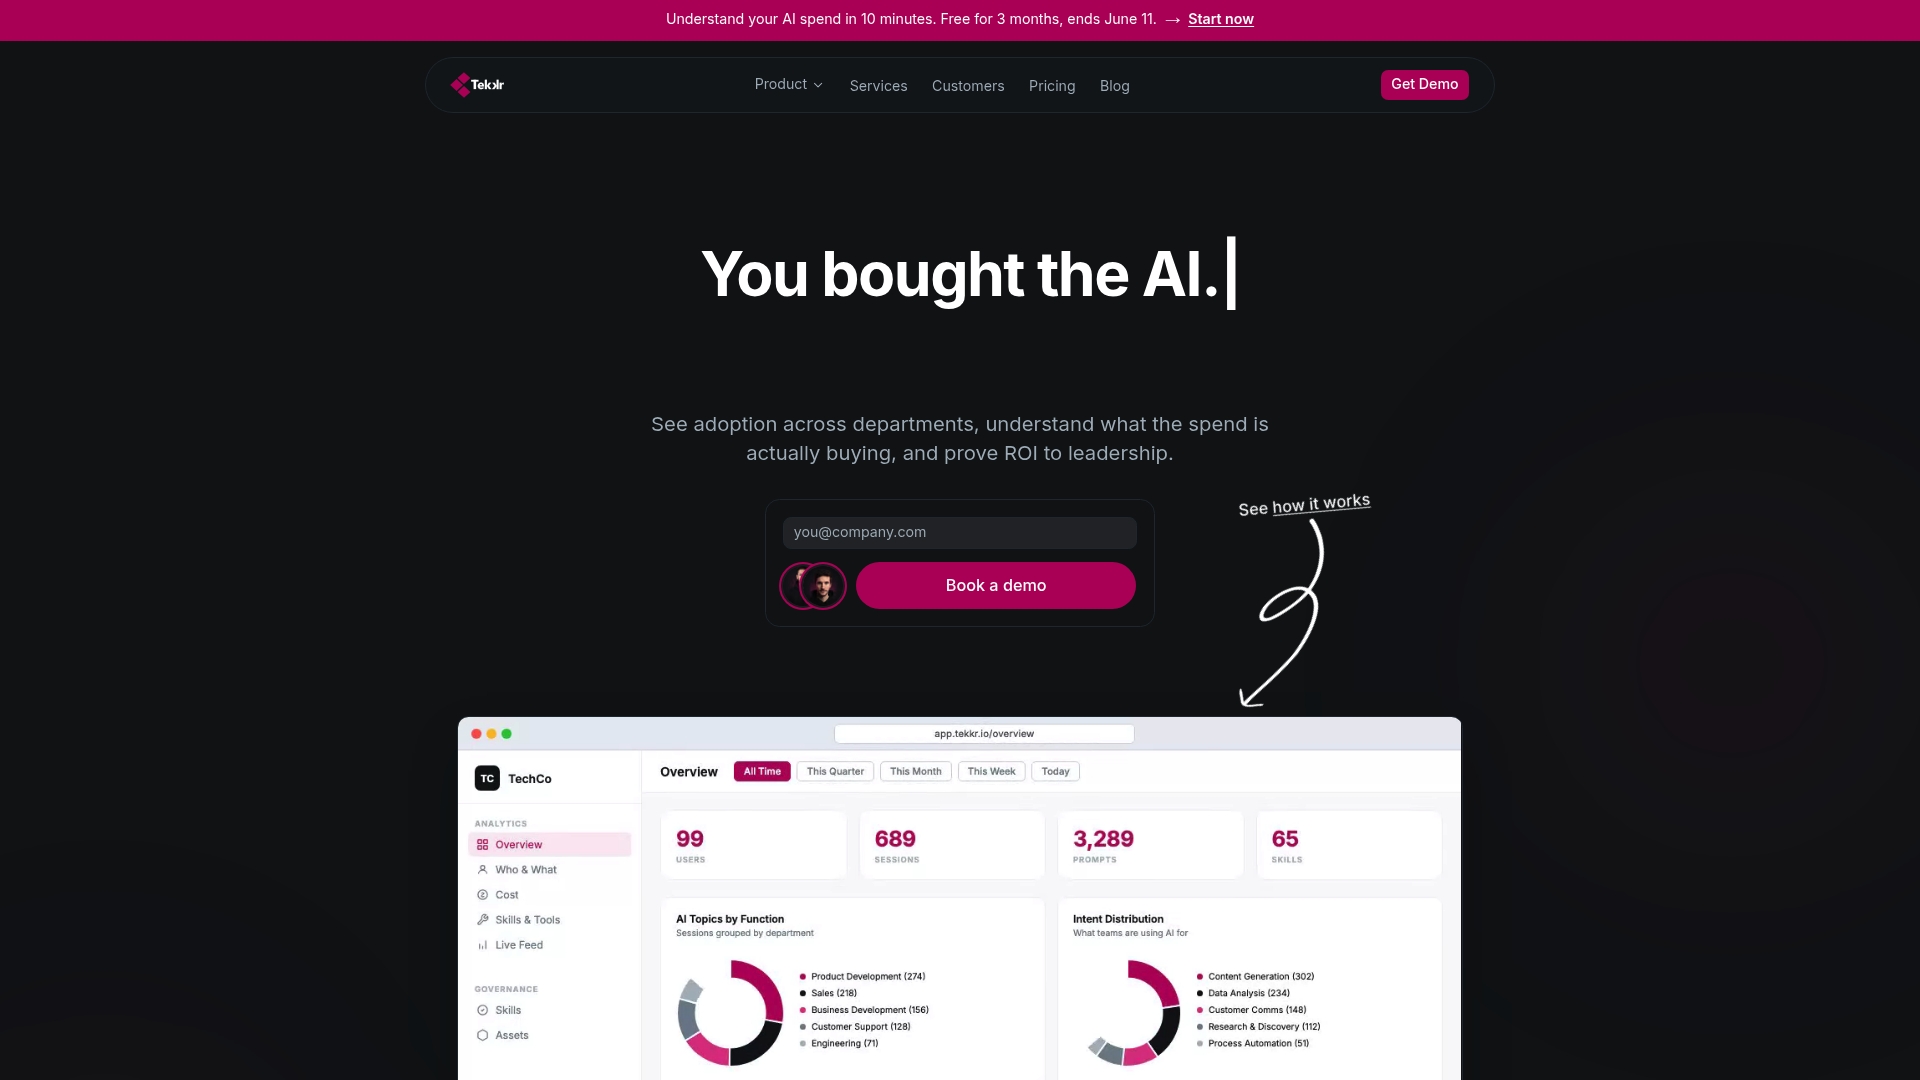
Adoption itself gets a push through gamified rollouts and leaderboards, so the tool doesn’t just measure usage, it helps drive it. Everything runs on a privacy-first, end-to-end encrypted architecture with automatic PII stripping, and setup takes about 10 minutes with no browser extensions required. The free tier means you can start capturing real attribution data on your highest-priority use case this week, no credit card needed. For teams that want structured help translating that data into a rollout strategy, Tekkr also offers hands-on consulting.
Start with the AI adoption solution page to see how Configurato maps to your current stack, or go straight to the product page to check setup requirements before your next budget review. Readers building out the measurement checklist described above can also follow Tekkr’s 30-day AI analytics setup guide for a step-by-step version of the playbook.
Sources
- 5 AI metrics that actually prove ROI to your board — Gartner
- Nobody knows where their AI budget is going — CIO
- New Harness report reveals enterprise AI spend has outgrown the systems built to track it — PR Newswire (Harness)
- Top tips for measuring generative AI productivity in the enterprise — IBM