
AI usage tracking is the practice of capturing telemetry from every AI touchpoint in your organization, then attributing that data to teams, costs, and business outcomes. The recommended enterprise pattern combines centralized telemetry with lightweight local collectors and privacy-first aggregation, because no single data source gives you the full picture.
Start by instrumenting these five sources:
- API telemetry from providers like Anthropic (Claude) and OpenAI (Codex) via server-side logging
- Billing records pulled from provider dashboards or cost-management APIs
- Local CLI/IDE hooks for developer tools that bypass your network proxy
- Proxy/gateway logs that capture web-based AI traffic across the organization
- SSO/team mapping to attribute usage to individuals, teams, and cost centers
For your first move, run a 4–8 week pilot with one team and a single proxy or SSO-integrated collector. Pick a team with measurable output (engineering, customer support, content), define one business KPI to move, and instrument only what you need to answer that question. Scope discipline is what separates pilots that graduate to production from ones that stall in a spreadsheet.
Key Takeaways
Effective AI usage tracking requires internal telemetry across at least three data sources, attributed to teams via SSO, with privacy controls in place before any data is collected.
| Point | Details |
|---|---|
| Prioritize telemetry over surveys | Public adoption estimates vary widely; internal API logs and billing records give you the only number finance will trust. |
| Instrument cost, adoption, and productivity | Track adoption rate, cost per active user, and a productivity delta together — no single metric tells the full story. |
| Strip PII before aggregation | Automatic prompt anonymization at the collection layer is the only approach that scales and satisfies legal review. |
| Run a short, scoped pilot first | A 4–8 week pilot with one team and one business KPI is faster to validate than a broad rollout and easier to kill if the data is bad. |
| Tekkr Configurato as a turnkey option | Configurato covers multi-account cost allocation, SSO mapping, proxy support, and PII stripping with a free tier and 10-minute setup. |
Table of Contents
- What AI usage metrics should you actually collect?
- Which architecture pattern fits your organization?
- How to stand up AI usage tracking step by step
- Privacy, compliance, and guardrails you need before you go live
- How do you measure ROI from AI usage data?
- What should you look for when evaluating AI usage monitoring tools?
- A real-world example: what Configurato found in a mid-size tech company
- Recommended next steps for your first 90 days
- What enterprise AI rollouts actually teach you
- Configurato by Tekkr: built for exactly this problem
- Primary sources and further reading
- Sources
What AI usage metrics should you actually collect?
The gap between “we have AI tools” and “we know what they’re doing for us” comes down to which metrics you instrument. Public surveys report divergent adoption rates depending on sampling and question framing — firm-level adoption estimates from the Business Trends and Outlook Survey (BTOS) were low in late 2025, while individual-level work GenAI adoption from the Reuters/Ipsos Poll Survey (RPS) was notably higher in the same period. That spread is not noise; it reflects genuinely different units of analysis. Internal telemetry is the only way to get a number your finance team can trust.
The six metric families that matter most:
| Metric | What it measures | Source of truth | Formula |
|---|---|---|---|
| Adoption rate | Share of eligible users who touched AI in the period | SSO + API logs | Active AI users ÷ total eligible users |
| Usage intensity | How frequently active users engage | API logs, proxy | Sessions or prompts per active user per week |
| Token/prompt volume | Raw consumption and model mix | Provider API logs | Tokens in + tokens out, by model |
| Cost per active user | Spend efficiency by team or function | Billing records | Total AI spend in period ÷ active users |
| Productivity delta | Time saved or error reduction vs. baseline | Task logs, surveys | (Pre-AI task time − Post-AI task time) × adoption rate |
| Risk exposure | Unsanctioned endpoints, data exfil attempts | Proxy, DLP, SIEM | Count of blocked or flagged events per period |
Three formulas worth bookmarking:
- Adoption rate = users who triggered at least one AI call in the period ÷ total users in scope
- Cost per active user = total AI spend in the period ÷ active users in the same period
- Productivity dollar value = (average time saved per task in hours) × (hourly fully-loaded cost) × (tasks completed with AI per period)
Each metric has a latency trade-off. API logs are near-real-time but miss local CLI usage. Billing records are accurate but lag 24–48 hours. Proxy logs are comprehensive for web traffic but require network routing changes. SSO data is authoritative for identity but tells you nothing about consumption volume. Combining at least three sources is what gives you a defensible number.
Stanford HAI’s AI Index 2026 documents that generative AI reached higher adoption faster than earlier technologies, with strong variation by sector and function. That variation is exactly why adoption rate and intensity metrics need to be tracked at the team level, not just the org level.
Which architecture pattern fits your organization?
There is no single right answer here. The pattern you choose depends on your network topology, your developer population, and how much operational overhead your platform team can absorb.
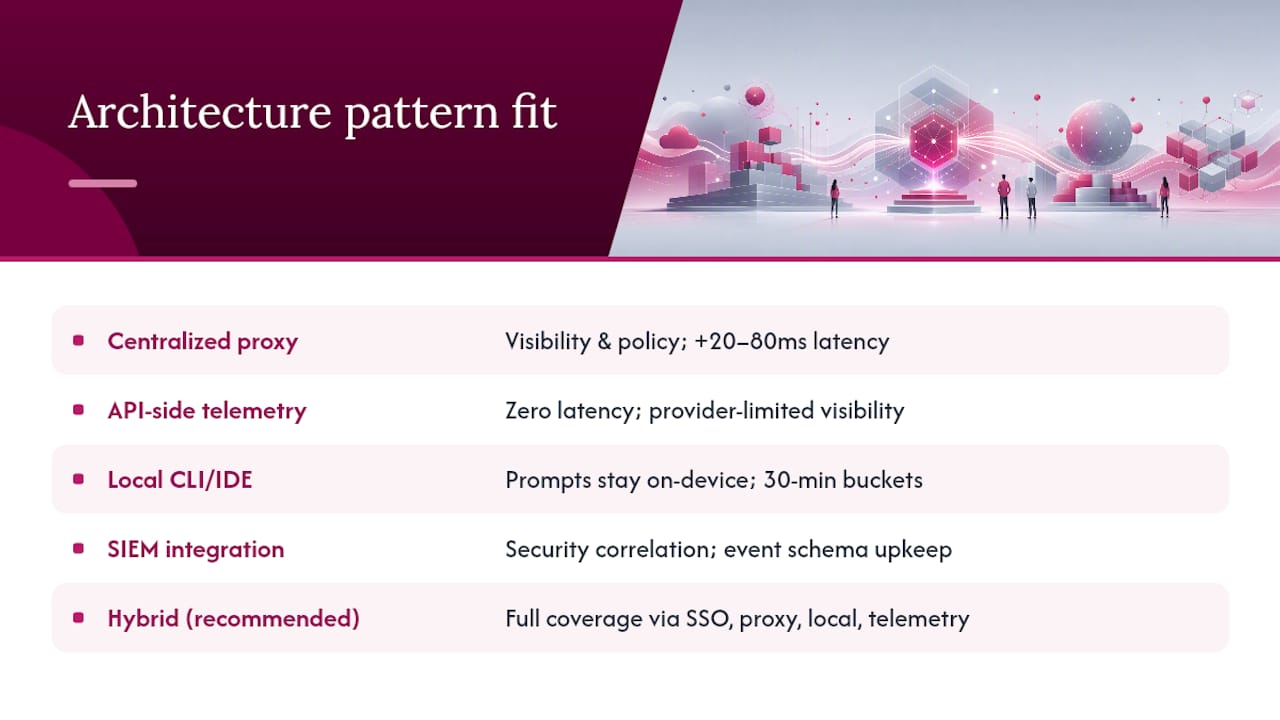
Centralized proxy/gateway routes all AI API calls through a single control point. You get complete visibility, policy enforcement, and cost attribution in one place. The downside is latency (typically 20–80ms added per call) and the engineering lift of routing every client through the gateway. Tools like Altrum AI Gateway illustrate this pattern: centralized routing with token budgeting, caching, and compliance controls. Best fit: organizations with a mature platform team and a relatively small number of AI-integrated applications.
API-side telemetry uses provider-native logging (OpenAI usage logs, Anthropic’s API response metadata) without any network interception. Zero latency impact, easy to stand up, but you only see what the provider exposes. You lose visibility into prompt content, and you cannot enforce policy at the call level. Best fit: early pilots where you need adoption and cost data fast and can accept incomplete coverage.
Local CLI/IDE collectors parse log files written by developer tools (GitHub Copilot, Claude Code, Cursor) directly on the developer’s machine, then batch-upload aggregated metrics. Open-source projects like VibeUsage demonstrate this pattern: local hooks, 30-minute UTC time buckets, project-aware analytics, and prompts that never leave the machine. Best fit: engineering organizations where developers use AI heavily outside the browser and proxy routing is impractical.
SIEM/observability integration feeds AI usage events into your existing security information and event management stack (Splunk, Datadog, Elastic). You get correlation with security events and a single pane of glass for ops teams. The cost is complexity: you need to define a clean event schema and maintain it as providers change their APIs. GitLab’s usage tracking documentation is a useful technical reference for structuring AI usage events and exposing them through GraphQL.
Hybrid pattern (recommended for mid-size enterprise): SSO identity layer → proxy gateway for web/API traffic → local collectors for CLI/IDE → telemetry lake with team attribution → reporting and policy enforcement. This covers the full surface area without requiring you to route developer CLI traffic through a corporate proxy, which developers will route around anyway.
For shadow AI discovery and enforcement, device-level monitoring can detect web-based AI tools that bypass your proxy entirely. The key is pairing discovery with a clear acceptable-use policy so enforcement feels like governance, not surveillance.
How to stand up AI usage tracking step by step
A pilot that runs longer than eight weeks without a clear success criterion almost never graduates to production. Keep the scope tight.
-
Inventory AI touchpoints (Week 0–1). List every AI tool your organization has licensed or that employees use informally. Check browser history samples, expense reports, and SaaS billing statements. You will find more tools than you expect.
-
Map identity sources (Week 1–2). Identify your SSO provider (Okta, Azure AD, Google Workspace) and confirm you can join AI usage events to user identities and team memberships. Without this, cost allocation is guesswork.
-
Deploy your first collector (Week 2–3). For most organizations, start with the proxy or API-side telemetry, not the local CLI collector. Get the high-volume, low-complexity source working first. GitLab’s event structure is a useful reference for defining your event schema before you write a line of code.
-
Capture billing and model metadata (Week 2–4). Pull provider billing data via API or CSV export. Tag each line item with model name, team, and use case where possible. This is your ground truth for cost reconciliation.
-
Build a minimal dashboard (Week 3–5). Adoption rate, cost per active user, and weekly intensity by team. Three metrics, one dashboard. Resist the urge to build everything at once.
-
Run parallel validation (Week 5–8). Reconcile your collected usage totals against provider billing. A variance of more than 5% signals a collection gap. Check team attribution accuracy by sampling 20–30 records and manually verifying the identity join.
Pro Tip: Cached token responses from providers like OpenAI can make your token counts look lower than your billing. Always reconcile against the billing API, not just the usage API, since cached completions are billed differently than fresh ones.
Pro Tip: Multi-account spend is the most common attribution error in early pilots. If your organization has separate API keys per team or per environment (dev/staging/prod), map every key to a team and environment before you aggregate. Mixing prod and dev spend inflates cost-per-user figures and makes the pilot look more expensive than it is.
For rollout beyond the pilot, plan 1–3 months per organizational wave. Prioritize teams with the highest AI spend or the clearest productivity hypothesis first. See AI productivity benchmarks for growth-stage companies for thresholds that help you set realistic pilot success criteria before you start.
Privacy, compliance, and guardrails you need before you go live
Collecting AI usage data without a privacy architecture is a liability, not just a compliance risk. The controls you need fall into two layers.
Technical controls:
- PII stripping and prompt redaction: Strip or hash any prompt content before it leaves the collection layer. Prompts frequently contain names, account numbers, and internal project details. Automatic PII stripping at the collector level, before aggregation, is the only approach that scales.
- Tokenization and anonymization: Replace user identifiers with pseudonymous tokens for storage. Keep the mapping table in a separate, access-controlled store.
- Encryption in transit and at rest: TLS 1.2+ for all telemetry transport; AES-256 or equivalent for stored logs and aggregated metrics.
- Role-based access control: Separate read access for team managers (their team’s data only) from admin access for platform owners (org-wide). Executives get aggregated reports, not raw logs.
- Audit logging: Every query against the telemetry store should itself be logged. This is what makes your data defensible in an audit.
Policy controls:
Decide before deployment whether monitoring is disclosed to employees or silent. In most U.S. jurisdictions, employers have broad latitude to monitor company systems, but disclosed monitoring is better for trust and adoption. Pair your technical rollout with an acceptable-use policy that defines which AI tools are sanctioned, what data employees may not submit to AI systems, and how usage data is used internally.
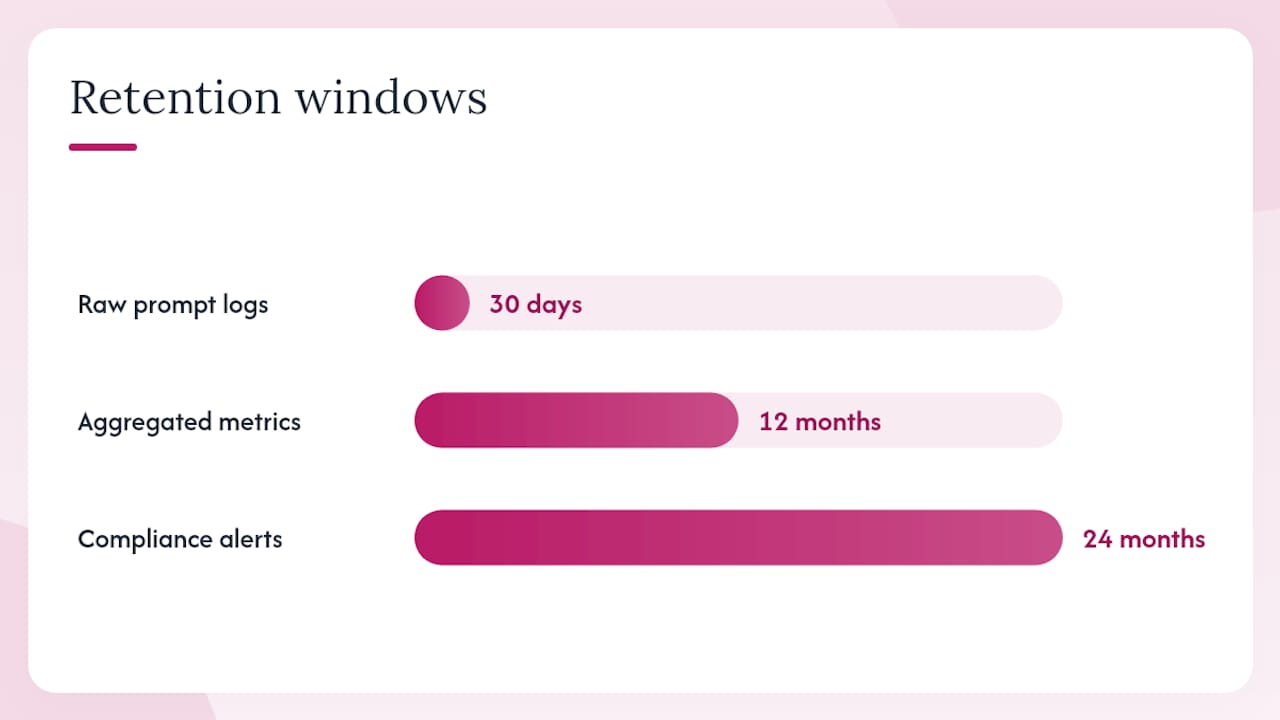
For GDPR readiness (relevant if your organization has EU employees or customers), ensure your data processing agreements with AI providers cover the telemetry data you collect, and that your retention schedules are documented. The recommended retention windows: raw prompt logs (if retained at all) for 30 days, aggregated usage metrics for 12 months, and compliance alerts for 24 months.
The data flow to implement: capture → anonymize/strip PII → aggregate by team and period → retain per schedule → expire raw data. Never store raw prompts longer than your incident-response window requires.
For shadow AI specifically, device-level monitoring tools can discover web-based AI tools that bypass your proxy, then enforce block/allow policies and integrate with DLP systems to prevent data leakage to unvetted models. Discovery without enforcement is just a list of problems.
How do you measure ROI from AI usage data?
The McKinsey State of AI 2025 survey found that many organizations report using AI in at least one business function, but most remain in experimenting or piloting stages, with only some attributing material EBIT impact to AI. The gap between “we use AI” and “AI moves our numbers” is a measurement problem as much as an adoption problem.
Four measurement approaches, in order of rigor:
-
Pre/post baseline. Measure a key task metric (time per ticket, error rate, lines of code reviewed) before AI deployment and again after. Simple, but confounded by seasonality and team changes.
-
A/B or holdout test. Give AI access to one group, withhold from a matched group, measure the difference. Requires enough sample size to be statistically meaningful, which usually means at least 30 users per arm and 4–6 weeks of data.
-
Cohort tracking. Segment users by adoption date and track their output metrics over time. Early adopters vs. late adopters give you a natural experiment without a formal holdout.
-
Unit economics. Convert usage telemetry directly into dollar value: (average time saved per task) × (hourly fully-loaded cost) × (tasks completed with AI per period) × (adoption rate). This is the number your CFO wants.
A worked example: a 50-person customer support team improved ticket resolution time after deploying an AI assistant. Savings per ticket and workload volume combined with hourly cost imply substantial recovered capacity per month. Compare this against your AI spend for the team to get an ROI estimate. That gives you a straightforward ROI ratio.
Watch for confounders: ticket complexity can shift month to month, new hires change the baseline, and seasonal volume swings affect throughput. Complement your telemetry with a short monthly survey (3–5 questions) and at least one output quality measure (customer satisfaction score, defect rate) to avoid false conclusions from the quantitative data alone.
When presenting to finance and exec stakeholders, show a sensitivity analysis. That range is more credible than a single point estimate, and it protects you when the CFO asks “what if your time-saving number is wrong?” For board-level AI reporting templates that translate telemetry into executive language, Tekkr’s guide covers the format in detail.
What should you look for when evaluating AI usage monitoring tools?
The vendor market for AI usage monitoring is maturing fast. Here is how to separate tools that will scale from ones that will create more work than they save.
Must-have features:
- Multi-account cost allocation with team-level granularity
- SSO/SCIM identity mapping (not just API key attribution)
- Proxy or gateway support for web-based AI traffic
- Local collectors for CLI/IDE tools used by developers
- Automatic PII stripping and encrypted prompt anonymization
- Exportable, audited logs for compliance reviews
- Role-based dashboards (team manager view vs. exec view vs. admin)
Important but not blocking:
- Native integrations with your existing observability stack (Datadog, Splunk, Grafana)
- Automated executive report generation on a weekly or monthly cadence
- Anomaly detection for cost spikes and quota exhaustion
- Use-case tagging to classify what AI is being used for
Nice to have:
- Gamified adoption features (leaderboards, playbooks, challenges)
- Benchmark data comparing your adoption metrics to industry peers
- Model recommendation engine suggesting cheaper models for specific task types
Procurement questions to ask every vendor:
- What deployment modes do you support (SaaS, VPC, on-prem)?
- Where does my data reside, and can I specify a U.S.-only data region?
- What is your SLA for telemetry latency (how fresh is the data)?
- How do you handle provider API changes that break your collection?
- What does your pricing model look like at 500 users? At 5,000?
- Do you support SCIM provisioning for automated user lifecycle management?
Security and scalability checklist:
- End-to-end encryption for all telemetry data in transit and at rest
- SOC 2 Type II certification or equivalent
- Documented data retention and deletion policies
- No requirement for browser extensions (a significant attack surface)
- Horizontal scalability for organizations with high API call volumes
- Vendor lock-in risk: can you export your historical data in a standard format?
For teams evaluating AI adoption best practices alongside vendor selection, the governance and rollout strategy questions matter as much as the feature checklist.
A real-world example: what Configurato found in a mid-size tech company
An anonymized mid-size software company (approximately 200 engineers and 80 business-side employees) deployed Tekkr’s Configurato to get a baseline on AI usage before expanding their tool licenses.
Baseline findings (Week 0): API billing showed $18,400/month in AI spend across four providers.
What was instrumented: SSO integration (Okta) for identity mapping, proxy gateway for web-based AI traffic, and local CLI collectors for the engineering team’s Copilot and Claude Code usage. Setup took under 15 minutes per component. No browser extensions were deployed.
Pilot duration: Six weeks.
Cost per active user dropped from $83.6/month to $30.2/month as the same spend was distributed across a larger active base. The engineering team reported an average of 40 minutes saved per developer per day on code review and documentation tasks.
Configurato’s prompt anonymization ran automatically at the collection layer. No raw prompt content was stored or visible to administrators. Every usage event was tied to a pseudonymous user token, with the identity mapping held separately under role-based access control. The company’s legal team reviewed the architecture against their internal data handling policy and signed off before the pilot went live.
Lessons learned:
- Multi-account API keys were the biggest early headache. Three teams had created their own keys outside the central billing account, which initially made cost attribution look wrong. Consolidating keys into a single org account with sub-account tagging fixed the reconciliation gap.
- Adoption numbers looked artificially low in week one because the SSO join was missing contractors who used a separate identity provider. Adding the contractor IdP took two days and corrected the count.
- Qualitative surveys run alongside the telemetry revealed that some high-usage employees were using AI for tasks the company had not anticipated (competitive research, contract summarization). That intelligence shaped the next wave of use-case enablement.
Pro Tip: Run a qualitative check in week three of any pilot. Ask five to ten users what they are actually using AI for. Telemetry tells you how much; users tell you what. The combination catches use cases your instrumentation was not designed to capture.
Recommended next steps for your first 90 days
The organizations that move from pilot to scaled deployment fastest share one trait: they define a measurable success criterion before they instrument anything.
-
Weeks 0–2: Inventory and baseline. List all AI tools in use (licensed and shadow). Pull 90 days of billing data from each provider. Identify your SSO provider and confirm you can join usage to team identities. Set one business KPI to move in the pilot.
-
Weeks 2–6: Instrument and collect. Deploy your first collector (proxy or API-side telemetry). Capture billing metadata. Build a three-metric dashboard: adoption rate, cost per active user, weekly intensity by team. Run the pilot with one team.
-
Weeks 6–12: Validate and plan scale. Reconcile collected usage against provider billing (target: less than 5% variance). Validate team attribution accuracy on a 20–30 record sample. Measure your pilot KPI against the baseline. If the data quality and productivity delta are both positive, present the case for org-wide rollout with a phased wave plan.
Decision points to graduate from pilot to scale:
- Billing reconciliation variance below 5%
- Team attribution accuracy above 90% on sampled records
- At least one measurable productivity signal (time saved, error reduction, output volume)
- Compliance signoff from legal or privacy team on the data handling architecture
For a deeper look at how to trace AI impact through to business outcomes, Tekkr’s guide walks through the traceability chain from raw telemetry to board-level reporting.
What enterprise AI rollouts actually teach you
The conventional wisdom on AI usage tracking is that you need comprehensive instrumentation before you can learn anything. That is wrong, and it causes more failed pilots than any technical problem.
The teams that get useful signal fastest pick one metric, one team, and one data source, then iterate. The teams that try to instrument everything simultaneously spend eight weeks on data plumbing and present a dashboard with no clear story to tell. Completeness is a second-phase problem.
The second thing most guides understate: attribution is harder than collection. Getting a token count from an API is trivial. Knowing which team, which use case, and which business outcome that token count belongs to requires identity mapping, cost center tagging, and a clear taxonomy of use cases. That taxonomy is worth spending a week on before you write a line of collection code.
A common early mistake: a platform team at a 400-person company attributed all AI spend to the engineering org because that team owned the central API keys. Business-side teams had been expensing AI tools individually and those costs never appeared in the central telemetry. The fix was a 30-minute audit of expense reports and a policy requiring all AI tool purchases to route through a single procurement process.
Pair your quantitative telemetry with a small set of qualitative checks every month. Three questions to five users per team takes 20 minutes and catches the things your dashboards miss: the use case that is quietly spreading, the tool that employees find frustrating enough to abandon, the workflow change that is saving time but not showing up in your task metrics yet.
Configurato by Tekkr: built for exactly this problem
Most organizations trying to stand up AI usage monitoring face the same choice: build a custom telemetry stack (expensive, slow, fragile) or buy a point solution that covers one data source but not the others.
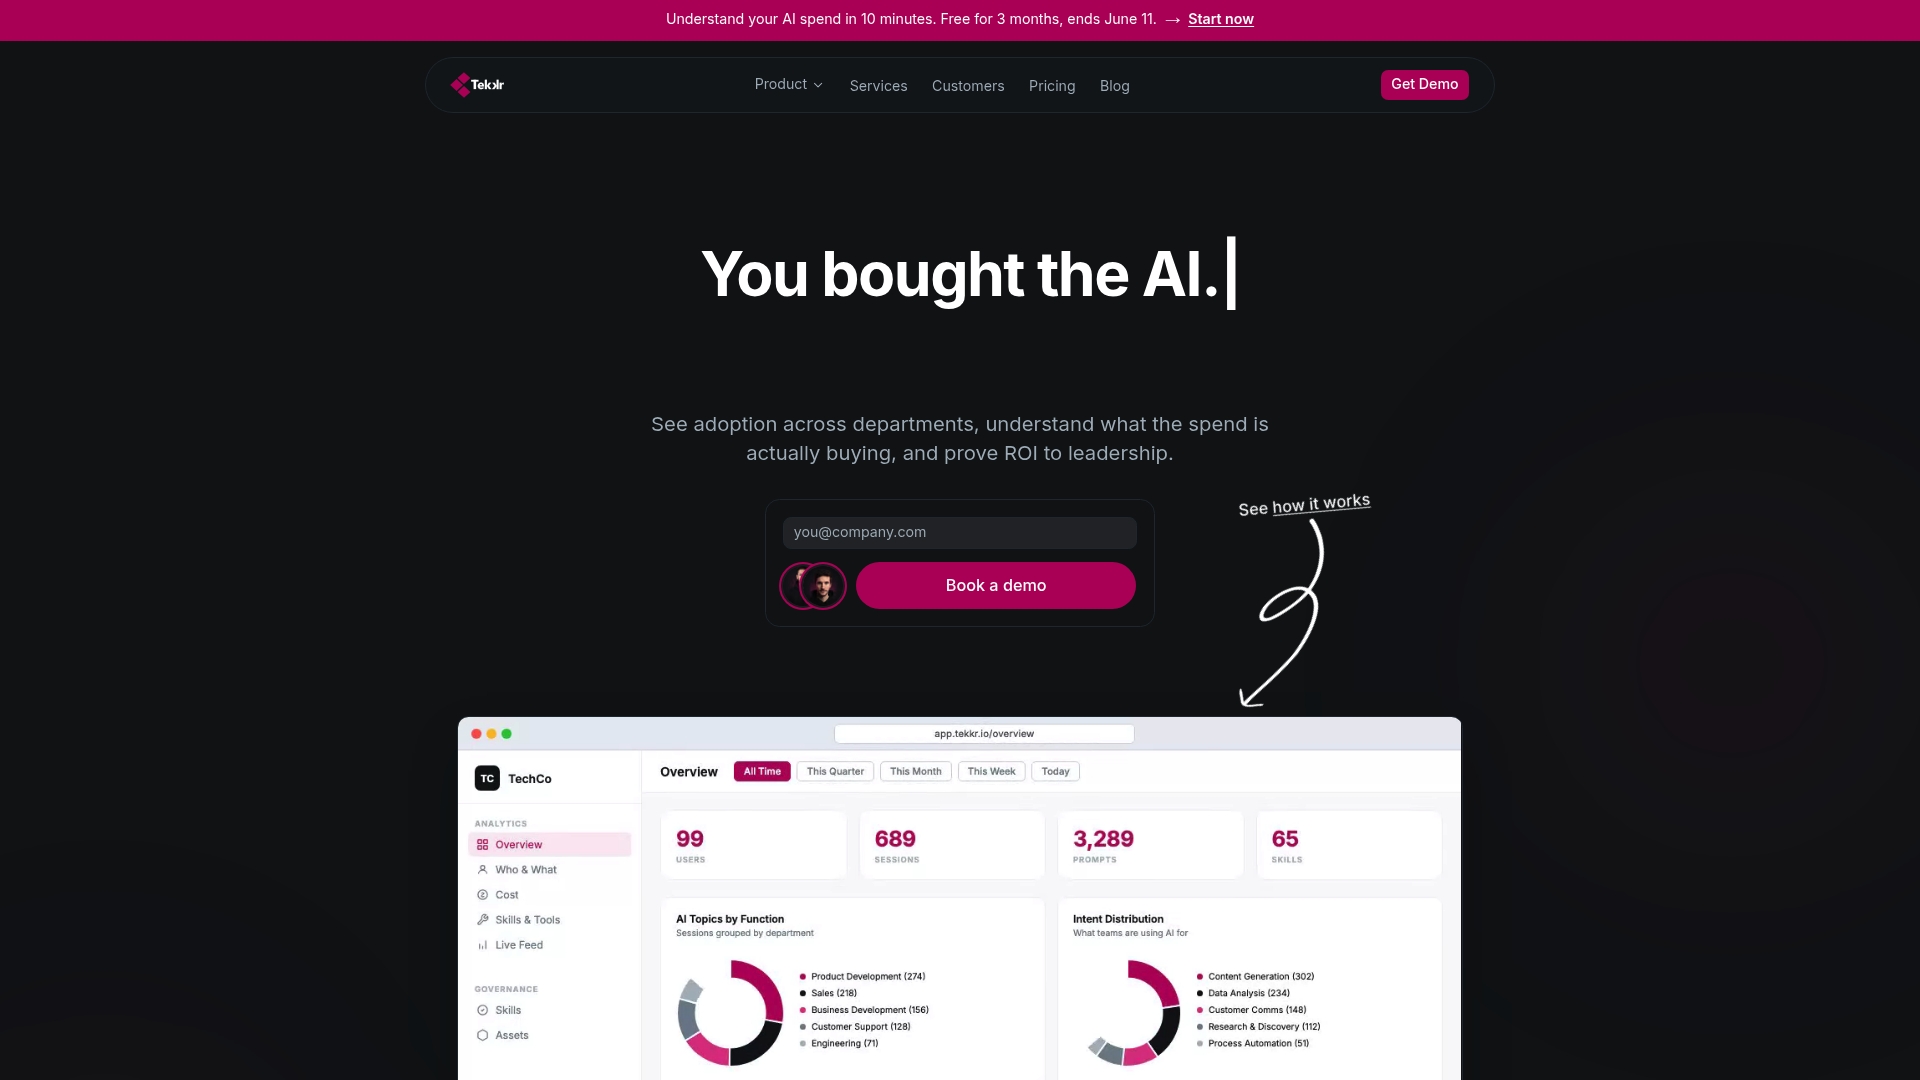
Tekkr’s Configurato covers the full stack in a single platform: multi-account cost allocation, SSO/SCIM identity mapping, proxy support for web-based AI traffic, local collectors for developer CLIs, automatic PII stripping, end-to-end encryption, and automated executive reports. It integrates natively with Claude and Codex, breaks costs down by team and use case, and surfaces the zombie licenses and cost anomalies that manual billing reviews miss. Setup takes about 10 minutes. There is a free tier with no credit card required.
For teams that want a guided rollout rather than a self-serve deployment, Tekkr also offers consulting engagements that cover instrumentation architecture, change management, and executive reporting design. See the AI adoption solutions page to book a demo or start a free trial.
Primary sources and further reading
- Monitoring AI adoption in the U.S. economy — Federal Reserve: Explains why BTOS, RPS, and SBU surveys produce materially different adoption estimates and why internal telemetry is necessary for objective measurement.
- The State of AI: Global Survey 2025 — McKinsey: Documents that most organizations remain in experimenting or piloting stages and identifies the measurement and workflow redesign practices that separate high performers.
- AI Index 2026, Chapter 4: AI Economy — Stanford HAI: Comparative adoption trajectories by sector and function, with evidence that generative AI diffused faster than earlier technologies.
- Microsoft AI Diffusion Report, Q1 2026: Population-normalized telemetry methodology and quarter-over-quarter diffusion measures; useful for benchmarking internal adoption rates against external signals.
- AI Diffusion Dataset, Q1 2026 — Microsoft (raw data): The underlying dataset behind the diffusion report, available for cross-checking and reproducibility.
- AI usage tracking — GitLab docs: Technical reference for event structure and GraphQL exposure of AI usage events; practical starting point for teams designing their own collection schema.
- VibeUsage — GitHub: Open-source example of a local CLI/IDE collector with 30-minute time buckets and privacy-focused design (prompts stay local).
- AIUsageTracker — GitHub: Open-source local dashboard for multi-provider token and cost aggregation; useful reference for lightweight local monitoring patterns.
Sources
- Monitoring AI adoption in the U.S. economy | Federal Reserve
- AI Index 2026 — Chapter 4: AI economy (Stanford HAI)
- AI usage tracking — GitLab docs