
Yes, enterprise AI spend can be forecasted into a usable range if you instrument attributed cost, run rolling forecasts, combine driver-based and time-series models, and govern the outputs with KPIs and alerts. The immediate next step is to wire up cost attribution at the API or gateway level and produce your first weekly rolling forecast. What follows covers the data you need, the models that work, and how to operationalize the whole thing so forecasts actually change decisions.
TL;DR:
- Forecasting AI spend becomes valuable when costs are large, unpredictable, or growing faster than other metrics, especially for high-cost, mission-critical, or multi-vendor use cases.
- Accurate models require detailed attribution telemetry, including token counts, model IDs, and business tags, which must be reconciled with actual billed costs to ensure data integrity.
- Weekly rolling forecasts, combined with backtesting and variance SLAs near five percent, enable proactive management and early detection of budget overruns.
- Key metrics for reporting include cost per work unit, GPU utilization, forecast accuracy, and anomaly counts, which help optimize cost efficiency and guide governance.
- Using industry benchmarks and regular variance review ensures internal forecasts stay realistic and aligned with overall AI market growth trends.
Table of Contents
- When forecasting AI spend is worth the effort
- The data you must collect first: attribution, tagging, and reconciliation
- Forecasting approaches: trend-based, driver-based, SARIMAX, and Prophet
- Operationalizing forecasts: cadence, backtesting, and ownership
- Key metrics and KPI definitions to report with forecasts
- Modeling major cost drivers and levers
- Benchmarks and industry trends to sanity-check internal forecasts
- Presenting forecasts to Finance, the CFO, and the board
- Tekkr’s approach: visibility-first forecasting and a pilot to prove it
- TekkrTools’ perspective: a 30/90/180-day checklist
- Get board-ready spend visibility with Tekkr
- Curated primary sources for further reading
- Sources
- FAQ
When forecasting AI spend is worth the effort
Not every AI line item needs a forecasting model. If a team spends a few hundred dollars a month on a single chatbot integration, a spreadsheet and a gut check will serve you fine. Forecasting earns its keep when spend is large, lumpy, or accelerating faster than headcount or revenue, which is exactly the pattern many enterprises are seeing as agentic workloads scale.
Start with the scopes that carry the most risk and the most volatility:
- High-cost teams: engineering or product groups running agents, RAG pipelines, or fine-tuning jobs with variable token consumption.
- Mission-critical use cases: customer-facing AI features where an outage or cost spike affects revenue or service level agreements.
- Fast-growing pilots: any use case moving from proof of concept to company-wide rollout, where usage curves are unpredictable.
- Multi-vendor stacks: teams mixing several model providers, since pricing changes and usage patterns compound across vendors.
The trade-off is instrumentation overhead against early warning value. Building attribution pipelines and running weekly forecasts takes engineering time and finance attention. For flat, predictable spend, that cost outweighs the benefit. For anything growing double digits’ month over month or touching agentic loops, the alternative, discovering a budget overrun after the invoice arrives, is far more expensive than the setup.
The data you must collect first: attribution, tagging, and reconciliation
A forecast is only as credible as the data feeding it. Before choosing a model, get the telemetry right, because a well-tuned SARIMAX model on bad data still produces a bad number.
Essential telemetry to capture at the API or gateway level includes per-call token counts, model identifier, input versus output token splits, latency, and error and retry counts. Retries matter more than most teams expect: a flaky endpoint can quietly double effective spend on a workload that looks stable on paper.
Layer structured tags on top of that telemetry so costs can be sliced by business dimension, not just technical one:
- Team or department, so finance can allocate spend without manual mapping.
- Use case, so product owners see which features drive cost.
- Environment, separating production, staging, and experimentation spend.
- Feature flag or rollout stage, to isolate pilot costs from steady-state usage.
- Dynamic metadata such as customer tier or workflow type, when the business model requires it.
Once telemetry and tags exist, reconcile them against the money that actually left the building. Map gateway logs to cloud billing exports and vendor invoices line by line, because API-reported usage and billed usage drift due to caching, retries, and free-tier allowances. This reconciliation step is also where shadow AI spend surfaces: teams expensing personal API keys or using unsanctioned tools outside the gateway. FinOps guidance on tools and services treats this kind of observability, gateway logs carrying model, team, and token metadata, as foundational to accurate cost allocation and forecasting.
Pro Tip: Run your first reconciliation manually for one month before automating it. You will catch tagging gaps that an automated pipeline would otherwise bake in permanently.
Forecasting approaches: trend-based, driver-based, SARIMAX, and Prophet
There is no single correct model for AI spend. The right choice depends on how many cost series you are forecasting, whether you have reliable business drivers, and how noisy each series is.
- Trend-based forecasting extrapolates historical spend curves and works as a scalable baseline when you have dozens of cost centers and no clear driver data yet.
- Driver-based forecasting ties spend to operational metrics such as active agent count, headcount, or active users, which makes it the best choice for scenario testing (“what happens if agent adoption doubles”).
- SARIMAX models add exogenous regressors to a seasonal time series, which suits cost centers where you have measurable drivers and need an auditable, explainable model for finance sign-off.
- Prophet handles messy series with changepoints and holiday effects well and scales quickly across many cost centers with minimal per-series tuning.
- Ensembling combines two or more of these and lets you pick the best performer per cost center after backtesting, rather than forcing one model on every series.
A useful rule of thumb: use trend-based or Prophet models when you are forecasting many series with limited driver data, and reserve SARIMAX for the handful of high-value cost centers where you can defend the regressors to an auditor. According to practical modeling guidance from TrueFoundry, SARIMAX works best where exogenous drivers genuinely exist, while Prophet tends to be more robust across many noisy series, and ensembles with backtesting outperform any single model choice in production.
A rolling weekly cadence catches vendor pricing shifts that quarterly forecasts miss. According to Gartner’s analysis of AI-optimized infrastructure spending, forecasting models for AI need to explicitly account for technical noise and vendor-driven pricing step-changes, and weekly rolling forecasts are often more operationally useful than quarterly cycles for catching these shifts early.
None of this matters if the forecast sits in a spreadsheet nobody checks. Treat the model choice as the easy part. The harder part, covered next, is making the forecast a living process instead of a one-time exercise.
Operationalizing forecasts: cadence, backtesting, and ownership
A forecast that runs once a quarter is a report. A forecast that runs weekly, gets back tested, and triggers alerts is a management tool. Enterprise AI spend moves too fast for the former to be useful on its own.
- Set cadence by volatility: run a weekly rolling forecast as the default for most AI cost centers, and move to daily forecasts for high-velocity production teams running agents or customer-facing inference at scale.
- Backtest before trusting the model: hold out recent weeks, compare predicted versus actual spend, and track mean absolute error and mean absolute percentage error over time.
- Set variance service level agreements: FinOps working group guidance recommends aiming for monthly forecast variance near 5% for well-managed processes, with a wider 5% to 15% range depending on organizational maturity.
- Build uncertainty bands, not point estimates: forecast a range, and treat the upper band crossing the approved budget as the trigger for review, not the median.
- Assign clear ownership: FinOps or finance owns budget discipline and variance reporting, while engineering supplies driver data and fixes instrumentation gaps when the model drifts.
The FinOps forecasting capability framework frames this as a maturity progression: crawl, walk, run, with variance targets tightening as allocation and backtesting improve.
Alerts matter as much as the forecast itself. A model that predicts a budget breach three weeks out is worthless if nobody acts on it. Route upper-band breaches to the team owning the cost center and to finance simultaneously, with a defined response window.

Pro Tip: Review your variance SLA every quarter. A target that made sense during a pilot phase usually needs tightening once a use case moves into steady-state production.
Key metrics and KPI definitions to report with forecasts
Forecasts land better with executives when they are expressed in unit economics rather than raw dollars. A raw spend number tells you nothing about whether that spend is efficient.
- Cost per unit of work: for example, dollars per 100,000 words generated, or dollars per resolved support query, calculated by dividing total attributed spend for a use case by the volume it produced.
- GPU utilization and cost per GPU hour: for teams running self-hosted or reserved capacity, utilization close to full capacity is the main lever engineering has to bring cost per unit down.
- Forecast accuracy metrics: variance percentage, mean absolute error, and mean absolute percentage error, tracked over time to show whether the forecasting process itself is improving.
- Anomaly counts: the number of times actual spend crossed an alert threshold in a given period, which tells leadership whether governance is catching problems early or only after the fact.
Near-100% GPU utilization is a stated target for cost-efficient AI infrastructure. FinOps guidance on forecasting AI services costs recommends tracking cost per unit of work alongside utilization targets close to full capacity to maintain cost efficiency, since idle reserved capacity erodes any gains a good forecast identifies.
Report these on a weekly operational dashboard for FinOps and engineering, and roll up to a monthly executive summary that pairs the forecast range with the KPI trend line. A board member does not need MAPE. They need to know whether cost per resolved query is going up or down, and whether that trend matches the growth the business is planning for.
Modeling major cost drivers and levers
Not all AI spend behaves the same way, and lumping inference, training, and retrieval into one forecast line hides the levers that actually move the number.
- Inference is typically the largest recurring cost and the most forecastable, since it scales roughly with usage volume and token counts once you have attribution in place.
- Training and fine-tuning costs are episodic rather than continuous, so model them as discrete events tied to a roadmap rather than smoothing them into a trend line.
- Embedding generation for RAG has both a recurring component, ongoing query costs, and a periodic one, refresh cadence for re-embedding a knowledge base, which should be modeled and forecast separately.
- Vector storage costs scale with corpus size and retention policy, and grow independently of query volume, so track them as their own line rather than folding them into query costs.
- Agentic systems carry the highest volatility because uncapped iteration loops can multiply cost unpredictably. Model these with a conservative maximum iteration cap rather than assuming average behavior, since FinOps guidance on AI tools and services flags agent loops and unthrottled inference endpoints as a genuine source of runaway billing spikes.
- Infrastructure choice between managed API pricing and self-hosted total cost of ownership shifts the forecast structure itself: managed pricing tracks usage closely, while self-hosted costs front-load capital commitment and depend heavily on committed-use discounts.
Prompt caching and hard iteration limits deserve special attention as forecasting levers rather than afterthoughts. They can reduce inference costs meaningfully, and because they are deterministic controls rather than usage predictions, they belong in your model as explicit scenario inputs, not just as engineering best practice.
Benchmarks and industry trends to sanity-check internal forecasts
Internal forecasts need an outside reference point, or they drift toward whatever number felt right last quarter. Three sources are worth checking regularly.
- Gartner projects worldwide AI spending to grow roughly 49.5% in 2026, with total spend reaching into the trillions and AI infrastructure standing as the largest spending category. Vendors define “AI spending” differently, so treat this as directional market context, not a template for your own line items.
- Stanford’s AI Spend Index publishes median and percentile AI spend per developer and per team, broken down by industry and team size, which is a more useful benchmark for sanity-checking your own per-developer or per-team forecast than a market-wide total.
- The FinOps community provides variance and cadence guidance built from practitioner experience across many organizations, which is the right reference for whether your own SLA target is realistic.
Market-wide growth rates should never become the growth rate in your own model. Gartner’s ~49.5% AI spending growth figure for 2026 describes the overall market, not any single company’s trajectory, and treating it as a per-organization forecast input is a common overfitting mistake.
Use benchmarks to flag when your internal number looks unusual, not to replace the driver data you have actually collected.
Presenting forecasts to Finance, the CFO, and the board
A forecast that shows up as a single number invites false confidence. A forecast presented as a range with clear interpretation invites a decision.
- Show the range with explicit meaning: the median is the planning baseline, and the upper band represents the risk scenario that should trigger review, not surprise, if it is approached.
- Translate drivers into business language: instead of showing a regression coefficient, state the scenario directly, for example that a 20% increase in agent rollout maps to a defined dollar impact on the forecast.
- Define the governance playbook in advance: specify what happens when the upper band crosses budget, whether that is throttling usage, pausing a rollout, or requesting contingency funds, before the threshold is actually hit.
- Keep the executive dashboard simple: one slide with the spend range, the KPI trend, and the current alert status is more useful in a board meeting than a page of model diagnostics.
The goal is a document that turns a technical forecast into a decision artifact. If the CFO cannot tell from the slide what action to take when the upper band is breached, the governance playbook is not finished yet.
Tekkr’s approach: visibility-first forecasting and a pilot to prove it
Configurato is built around the same principle this article has argued for: attribution has to come before modeling. It tracks who is actually using tools like Claude and Codex, breaks spend down by team and use case, and feeds that attributed data directly into forecasting and reporting rather than leaving it locked in raw billing exports.
- Attribution first: Configurato surfaces cost by team, use case, and tool without requiring browser extensions, so the telemetry described earlier in this article gets captured automatically.
- Use-case intelligence: it identifies which workflows drive the most spend and which drive the least return, which is the input a driver-based forecast needs.
- Privacy-first architecture: everything runs end-to-end encrypted and GDPR-compliant, with automatic PII stripping on prompts, so finance gets cost visibility without exposing sensitive content.
- Measured impact: enterprises that start with visibility rather than model tuning have cut AI spend by 40 to 60%, according to Tekkr’s internal reporting on visibility-first optimization projects.
A 30-day observability pilot wires up this attribution layer, produces a board-ready spend and adoption report, and establishes the forecast baseline your team can then run weekly against.
TekkrTools’ perspective: a 30/90/180-day checklist
Most enterprises try to skip straight to a sophisticated model and skip the boring part: attribution. That is backward. A mediocre trend line on clean, tagged data will outperform a beautiful SARIMAX model built on unreconciled invoices every time.
For the next 30 days, instrument cost attribution at the gateway level and run your first weekly rolling forecast, even if it is rough. Surface anomalies as you go rather than waiting for a clean dataset that never quite arrives.
Over the following 90 days, backtest whatever models you have chosen, set variance SLAs, and turn on alerting. If you want a faster path to that baseline, this is also the point to consider a pilot with a tool like Configurato rather than building the pipeline from scratch.
By 180 days, fold the forecast into your actual budgeting cycle, and where usage patterns have stabilized, start negotiating committed capacity discounts with vendors instead of paying for on-demand pricing indefinitely.
— TekkrTools
Get board-ready spend visibility with Tekkr
Everything in this playbook depends on one thing: attributed cost data that is trustworthy enough to model. Configurato builds that foundation directly, tracking adoption and spend by team and use case with a quick setup and offering a free tier.
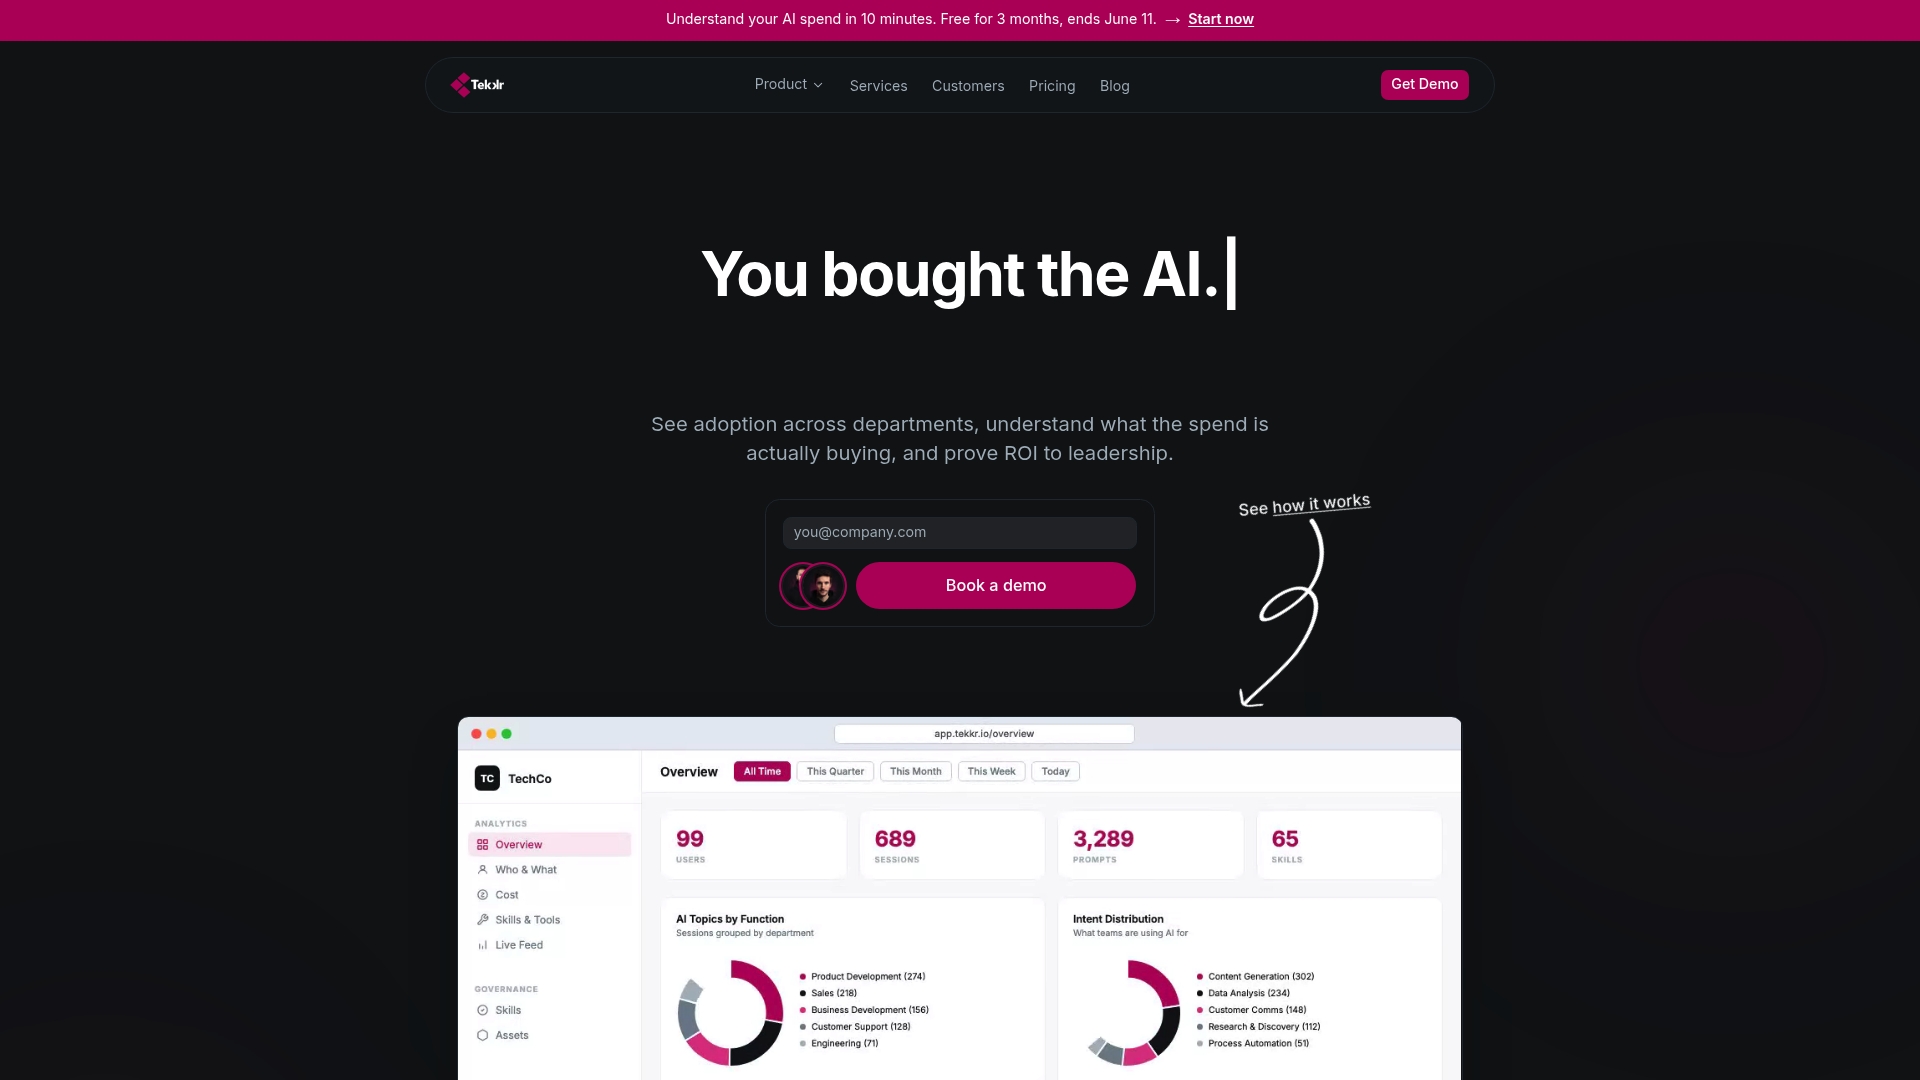
For teams that want the operational playbook built alongside the tooling, Tekkr’s AI Adoption Programs pair Configurato with hands-on governance and rollout strategy rather than leaving you to build variance SLAs and alerting from a blank page.
- A 30-day pilot delivers attribution wiring, a forecast baseline, and a board-ready report on adoption and spend.
- Pricing for readiness assessments, transformation engagements, and embedded operator support is listed on the Tekkr pricing page.
- Consulting support for governance, agent deployment, and evaluation is available through Tekkr’s services for teams that want the forecasting model built alongside the operational playbook.
Check availability for the observability pilot or review plan details on the pricing page to see which engagement fits your current stage.
Curated primary sources for further reading
For readers who want to go deeper on the models, benchmarks, and governance standards referenced above:
- FinOps working group guidance on forecasting AI services costs, covering cadence, variance targets, and utilization metrics.
- FinOps for AI: tools and services considerations, covering observability requirements and agent loop risk.
- Gartner’s 2026 worldwide AI spending forecast, for market-level context.
- Stanford’s AI Spend Index, for per-developer and per-team benchmarks.
Sources
- How to Forecast AI Services Costs in Cloud — FinOps Working Group
- Gartner forecasts worldwide AI spending to grow 49.5% in 2026 — Gartner
- AI Spend Index — Stanford
- FinOps for AI: Tools & Services Considerations — FinOps
FAQ
How do you use AI to track spending?
You track AI spending by instrumenting cost attribution at the API or gateway level, capturing per-call token counts, model identifier, and team or use-case tags, then reconciling that data against cloud billing and vendor invoices. Platforms like Configurato automate this capture so spend can be broken down by team and use case without manual log parsing.
How is AI used in forecasting AI spend itself?
Forecasting AI spend uses time-series and driver-based models such as SARIMAX and Prophet, applied to attributed cost data broken down by team, model, and use case. Practical guidance from TrueFoundry notes that SARIMAX suits cost centers with clear exogenous drivers, while Prophet handles many noisy series with changepoints more easily.
Is the AI spending bubble bursting?
There is no consensus that AI spending is contracting. Gartner projects worldwide AI spending to grow roughly 49.5% in 2026, with total spend reaching into the trillions, which points to continued growth rather than a downturn at the market level.
How much has been spent on AI in 2026?
Total worldwide AI spending in 2026 is projected to reach into the trillions, according to Gartner’s 2026 forecast, which also identifies AI infrastructure as the largest spending category. For a benchmark closer to your own organization, Stanford’s AI Spend Index offers median spend per developer and per team, broken down by industry and team size.
What variance should a mature AI spend forecast target?
A well-managed AI spend forecasting process should aim for monthly variance near 5%, according to FinOps working group guidance, with a wider range of 5% to 15% acceptable depending on organizational maturity. Teams still building out attribution and tagging should expect to sit at the higher end of that range until their instrumentation matures.