
AI showback reporting is the practice of measuring and displaying an organization’s AI usage, spending, and return by team and use case, without routing charges back through internal billing. The immediate move for most finance and AI leaders: stop waiting for a perfect system and run a 30-day observability pilot on your three highest-spend AI tools now, so you have real usage and cost data before the next budget cycle.
TL;DR:
- Running a 30-day pilot on your highest-spend AI tools provides actionable usage and cost data before the next budget cycle.
- Showback reporting tracks tool usage, spend, and productivity signals without impacting compute bills, requiring collaboration with finance, AI leads, and IT.
- Focus on key metrics: active users and adoption rates, spend per provider and task, outcomes like time saved, and trust indicators such as error rates and privacy flags.
- Collect data from vendor telemetry, billing records, identity systems, and embedded workflow hooks, with anonymization and privacy controls from day one.
- Integrate showback into existing financial and governance processes by using standard reporting cycles, linking to KPIs, and assigning ownership for data quality.
Table of Contents
- What Does AI Showback Reporting Actually Cover?
- What Metrics Should an Enterprise Showback Report Include?
- How Do You Collect and Attribute Showback Data?
- What Should Showback Dashboards and Board Reports Include?
- How Does NIST AI RMF Apply to Showback Governance?
- How Do You Roll Out Showback: Pilot to Scale?
- What Are the Common Pitfalls in AI Showback Data?
- How Do You Fold Showback Into Existing Finance and IT Governance?
- How Do You Explain Showback Data to a Non-Technical Board?
- What Does Successful Showback Implementation Look Like?
- How Do You Handle Spikes and Anomalies in AI Spend Data?
- Perspective: Measurement Should Drive Adoption, Not Police It
- How Tekkr Helps You Build Board-Ready Showback Reports
- Sources
- FAQ
What Does AI Showback Reporting Actually Cover?
Showback reporting measures three things: who’s using which AI tools, what they cost, and what they’re producing in return. It’s informational, not transactional. No department gets an invoice.
That distinction matters because AI showback gets confused constantly with cloud FinOps showback, the older practice of allocating server and storage costs across engineering teams. AI showback is a different discipline. It tracks usage of tools like Claude and Codex, subscription and API spend by provider, and the productivity or revenue signal tied to each use case. It never touches your compute bill.
Ownership typically sits with a finance sponsor (CFO or VP Finance) paired with a Head of AI or product lead, plus IT for data access and a privacy or compliance officer to sign off on how prompt data gets handled. Skip any of these three and the report either lacks financial credibility, misses the operational context, or creates a compliance headache six months later.
Done right, showback slots into your existing reporting cadence rather than replacing it. It feeds the same monthly finance review and quarterly board deck your other operational metrics already populate, just with a new data source behind it.
What Metrics Should an Enterprise Showback Report Include?
Most showback programs fail not because they lack data, but because they track the wrong things or too many things. Four categories cover what actually matters.
Usage metrics tell you adoption is real, not aspirational. Track active users per tool, session frequency, and adoption rate against total licensed seats. A tool with 500 seats and 40 weekly active users is a budget problem wearing an adoption disguise.
Spend metrics break costs into something a CFO can act on: total spend, spend by provider or API, cost per active user, and cost per completed task or use case. Aggregate spend alone tells you nothing about where the money is working.
Outcome metrics are where most reports go weak. Track minutes or hours saved per workflow, throughput changes (tickets closed, code shipped, drafts produced), and any defensible revenue proxy tied to AI-assisted work.
Trust and health metrics round out the picture: error or hallucination rates, incident counts, and privacy events flagged during review.
- Usage: active users, session frequency, adoption rate vs. licensed seats
- Spend: total cost, cost by provider, cost per user, cost per task
- Outcomes: time saved, throughput change, revenue proxy
- Trust: error rate, incidents, privacy flags
Seventy-two percent of organizations already measure Gen AI ROI formally, with most focusing on productivity gains and incremental profit, according to Wharton’s 2025 AI adoption research. If your organization has no formal measurement in place yet, you’re behind roughly three out of four peers, not ahead of a curve.
How Do You Collect and Attribute Showback Data?
Instrumentation is where most showback initiatives stall, usually because teams try to build a perfect pipeline before proving the signal is even worth collecting. Start smaller.
You need four data sources working together, not one master feed:
- API and provider telemetry from your AI vendors, which gives raw usage counts and token or call volume.
- SaaS billing records for subscription tools, matched against seat assignments.
- SSO and identity data to map usage back to specific teams and roles without relying on self-reported logs.
- Observability hooks embedded in workflows, which catch usage that never touches a billing system, like a shared API key used across a department.
Attribution gets messy fast when multiple teams share a single API key or when a use case spans two departments. Tag at the request level where possible, and use sampling for high-volume APIs rather than trying to log every call. The NIST AI RMF playbook recommends audit logs and documented human-oversight metrics as part of instrumentation, which is a useful discipline even outside a formal risk framework, per NIST’s Measure guidance.
Privacy has to be built in from day one: strip personally identifiable information automatically, anonymize prompts before storage, and encrypt data in transit and at rest. Retrofitting privacy controls after a data breach conversation is far more expensive than building them first.
Pro Tip: Run your pilot on the three tools with the highest monthly spend, not the ones with the most users. High spend with unclear ROI is the fastest way to lose executive buy-in for the whole program.
What Should Showback Dashboards and Board Reports Include?
Different audiences need different views of the same data, and conflating them is a common mistake. A board member doesn’t want the drilldown a data analyst needs, and vice versa.
- Executive board summary: one page showing headline spend, an ROI proxy tied to outcomes, a trend line, and a specific ask (more budget, a tool consolidation, a pilot expansion).
- Operational dashboard: team-level and use-case-level drilldowns with alerting when spend or error rates spike unexpectedly.
- Showback statement: a monthly, team-level breakout of usage and spend, purely informational, with no billing action attached.
Cadence matters as much as content. Run operational dashboard reviews monthly, and reserve the polished board summary for quarterly cycles, tied to the board-level AI reporting examples that finance teams increasingly build into standard governance reviews.
How Does NIST AI RMF Apply to Showback Governance?
Showback data only earns trust if it can survive scrutiny, and that’s where a formal measurement standard helps more than an internal spreadsheet convention.
The NIST AI RMF’s “Measure” function requires organizations to select appropriate methods and metrics, document what can’t reliably be measured, and establish repeatable testing, evaluation, verification, and validation processes, known as TEVV, alongside continuous monitoring, according to NIST’s AI RMF guidance. Applied to showback, that means writing down your assumptions, not just your numbers.
Measurement that only shows what looks good, while staying silent on what can’t be captured, isn’t measurement. It’s marketing. Documenting the limits of a metric is what makes a board willing to act on it.
Mix quantitative signals (session counts, token spend) with qualitative checks (a short survey asking teams whether a tool actually changed how they work). Numbers alone miss adoption friction that a five-minute conversation surfaces immediately. Independent review, someone outside the team reporting the numbers, catches the inevitable bias of teams grading their own AI investment.
How Do You Roll Out Showback: Pilot to Scale?
A phased rollout beats a big-bang deployment almost every time, mainly because it lets you catch bad data before it reaches a board deck.
- Design a 30-day pilot scoped to two or three high-spend tools, with success defined by data completeness, signal quality, and an early ROI proxy, not perfect coverage.
- Assign roles before you start: a finance owner, an AI or product lead, and an IT contact for data access, with a defined decision gate at day 30 to go, adjust, or stop.
- Scale with standard tagging conventions so team and use-case attribution stays consistent as you add tools.
- Layer in adoption mechanics, playbooks and light gamification like leaderboards, once the measurement layer is stable, so visibility drives usage instead of just auditing it.
The 30-day use case analytics playbook approach mirrors what ISG found: only 31% of AI use cases reached full production in 2025, often stalling on measurement gaps rather than the technology itself, per ISG’s enterprise AI adoption report.
What Are the Common Pitfalls in AI Showback Data?
Most showback programs don’t fail on ambition. They fail on a handful of repeatable mistakes.
- Double-counting: shared API keys and overlapping tool subscriptions inflate spend attributed to a single team. Fix it with allocation rules and periodic sampling audits.
- Shadow AI spend: employees expensing personal ChatGPT or Claude subscriptions outside procurement. Combine billing records, identity data, and a short quarterly survey to surface it.
- Noisy short-term signals: a single spike in usage doesn’t mean adoption stuck. Tie usage data to outcome metrics and a TEVV-style review cadence before drawing conclusions.
- Privacy gaps: raw prompt logs sitting unencrypted in a shared drive. Anonymize, strip PII automatically, and document what data you’re deliberately not collecting.
How Do You Fold Showback Into Existing Finance and IT Governance?
Retrofitting showback into governance structures that already exist beats building a parallel system nobody trusts.
Start with the budget cycle you already run. Most finance teams operate on quarterly or annual planning cadences; slot AI showback reviews into the existing monthly close and quarterly business review rather than inventing a new meeting series. The data should show up as a line item in the same operating reviews where marketing spend or headcount costs already get scrutinized, not in a standalone “AI committee” that meets separately and gets ignored.
On the IT side, showback needs a seat in whatever change management or vendor approval process already governs new software purchases. If procurement requires a security review before approving a new SaaS tool, that same intake process should trigger a showback tag, assigning the tool to a team and use case before the first invoice arrives. Retrofitting attribution after the fact is far messier than building it into intake.
Governance frameworks built around McKinsey’s finding, that tracking well-defined KPIs and redesigning workflows correlates most strongly with bottom-line impact, work best when showback metrics feed directly into the same KPI dashboards executives already review for other operational spend, according to McKinsey’s state of AI research. Don’t build a separate AI scorecard living in a different tool than the rest of your operating metrics. Executives ignore dashboards they have to remember to open.
Finally, assign a named owner for data quality, not just data collection. Someone has to be accountable when a number looks wrong, and “the AI team” is not a name.

How Do You Explain Showback Data to a Non-Technical Board?
Board members don’t need to understand tokens, API calls, or model architecture. They need to understand whether the money is working, and what happens if it isn’t.
Lead every board conversation with the outcome metric, not the usage metric. “Legal’s contract review time dropped by roughly a third after AI tool adoption” lands better than “Legal ran 4,200 AI queries last quarter.” The usage number is supporting evidence, not the headline.
Use a consistent one-page format every quarter so board members build pattern recognition over time. A board that sees the same layout, same four or five metrics, same trend line, quarter after quarter starts noticing deviations immediately. A board that gets a redesigned report every cycle spends its attention relearning the format instead of evaluating the trend.
Translate spend into a comparison the board already understands: cost per employee per month, compared against the productivity gain in hours or output. Raw dollar figures without context invite the wrong question (“why does this cost so much?”) instead of the right one (“is this worth what it’s returning?”).
Be honest about what you can’t yet measure. The NIST framework’s insistence on documenting measurement limits applies directly here: a board that hears “we’re confident in spend and usage numbers, but our revenue-proxy metric still needs another quarter of data” trusts the report more than one making confident claims on shaky ground, according to NIST’s Measure guidance.
What Does Successful Showback Implementation Look Like?
The pattern across organizations that get showback right isn’t sophistication. It’s sequencing.
Teams that succeed almost always start with a narrow pilot, two or three tools, one or two departments, rather than trying to instrument every AI touchpoint in the company simultaneously. A legal team piloting AI-assisted contract review, for instance, generates a clean signal: fewer tools, a defined workflow, and an obvious outcome metric (review time per contract) that doesn’t require guesswork to interpret.
The organizations that stall almost always tried to build enterprise-wide coverage first. They spent months mapping every tool across every department before producing a single usable report, and by the time the dashboard existed, the underlying tool landscape had already shifted. Menlo Ventures’ research on enterprise generative AI spending shows budgets accelerating quickly even as enterprise-level impact stays uneven across organizations, a gap that a pilot-first approach helps close faster than a comprehensive-first one, according to Menlo Ventures’ 2025 enterprise AI report.
Productivity gains compound once measurement legitimizes further investment. Research on AI-driven productivity across agency and analytics-heavy work found returns multiplying several times over when organizations paired adoption with structured measurement rather than ad hoc rollout, a pattern documented in analysis of AI productivity gains. The lesson holds across sectors: measurement doesn’t just report success, it funds the next round of it.

How Do You Handle Spikes and Anomalies in AI Spend Data?
A spend spike in your showback data means one of three things: adoption is genuinely accelerating, usage is being double-counted, or someone’s misusing an API key. Treating all three the same way, either ignoring the spike or panicking over it, wastes the signal.
First, check for the boring explanation. A new hire onboarding wave, a seasonal workload increase, or a single team running a large one-time project through an AI tool can all produce a legitimate spike that looks alarming in isolation. Cross-reference the spike against headcount changes and known project timelines before treating it as a problem.
Second, isolate whether it’s a usage spike or a cost-per-use spike. Usage climbing while cost-per-task stays flat usually signals healthy adoption. Cost-per-task climbing while usage stays flat often points to inefficient prompting, a pricier model tier getting used unnecessarily, or a vendor price change nobody flagged.
Third, set alert thresholds tied to percentage change rather than absolute dollar figures, since a small team’s spend can double on a modest dollar increase while a large team’s spend needs a much bigger swing to trigger the same percentage threshold. Route alerts to the finance owner and the relevant team lead simultaneously, not finance alone, so the person closest to the workflow can explain the context within a day, not a reporting cycle later.
Perspective: Measurement Should Drive Adoption, Not Police It
The mistake we see most often is treating showback as an audit tool aimed at catching overspending teams. That framing backfires. Visibility should fund the next round of investment, not justify budget cuts.
A pilot-and-playbook approach, instrument first, then use what you learn to guide rollout, turns raw usage data into a genuine adoption lever. Measurement has to stay transparent enough that teams trust the numbers, because a showback program employees suspect is secretly a chargeback program in disguise will drive shadow AI usage underground fast.
— TekkrTools
How Tekkr Helps You Build Board-Ready Showback Reports
Tekkr built Configurato specifically for the problem this article walks through: turning scattered AI usage and spend signals into a report a board will actually trust. It tracks who is using various AI tools, breaks spend down by team and use case, and strips personally identifiable information automatically inside a privacy-first, end-to-end encrypted architecture built to data protection standards, with no browser extensions required.
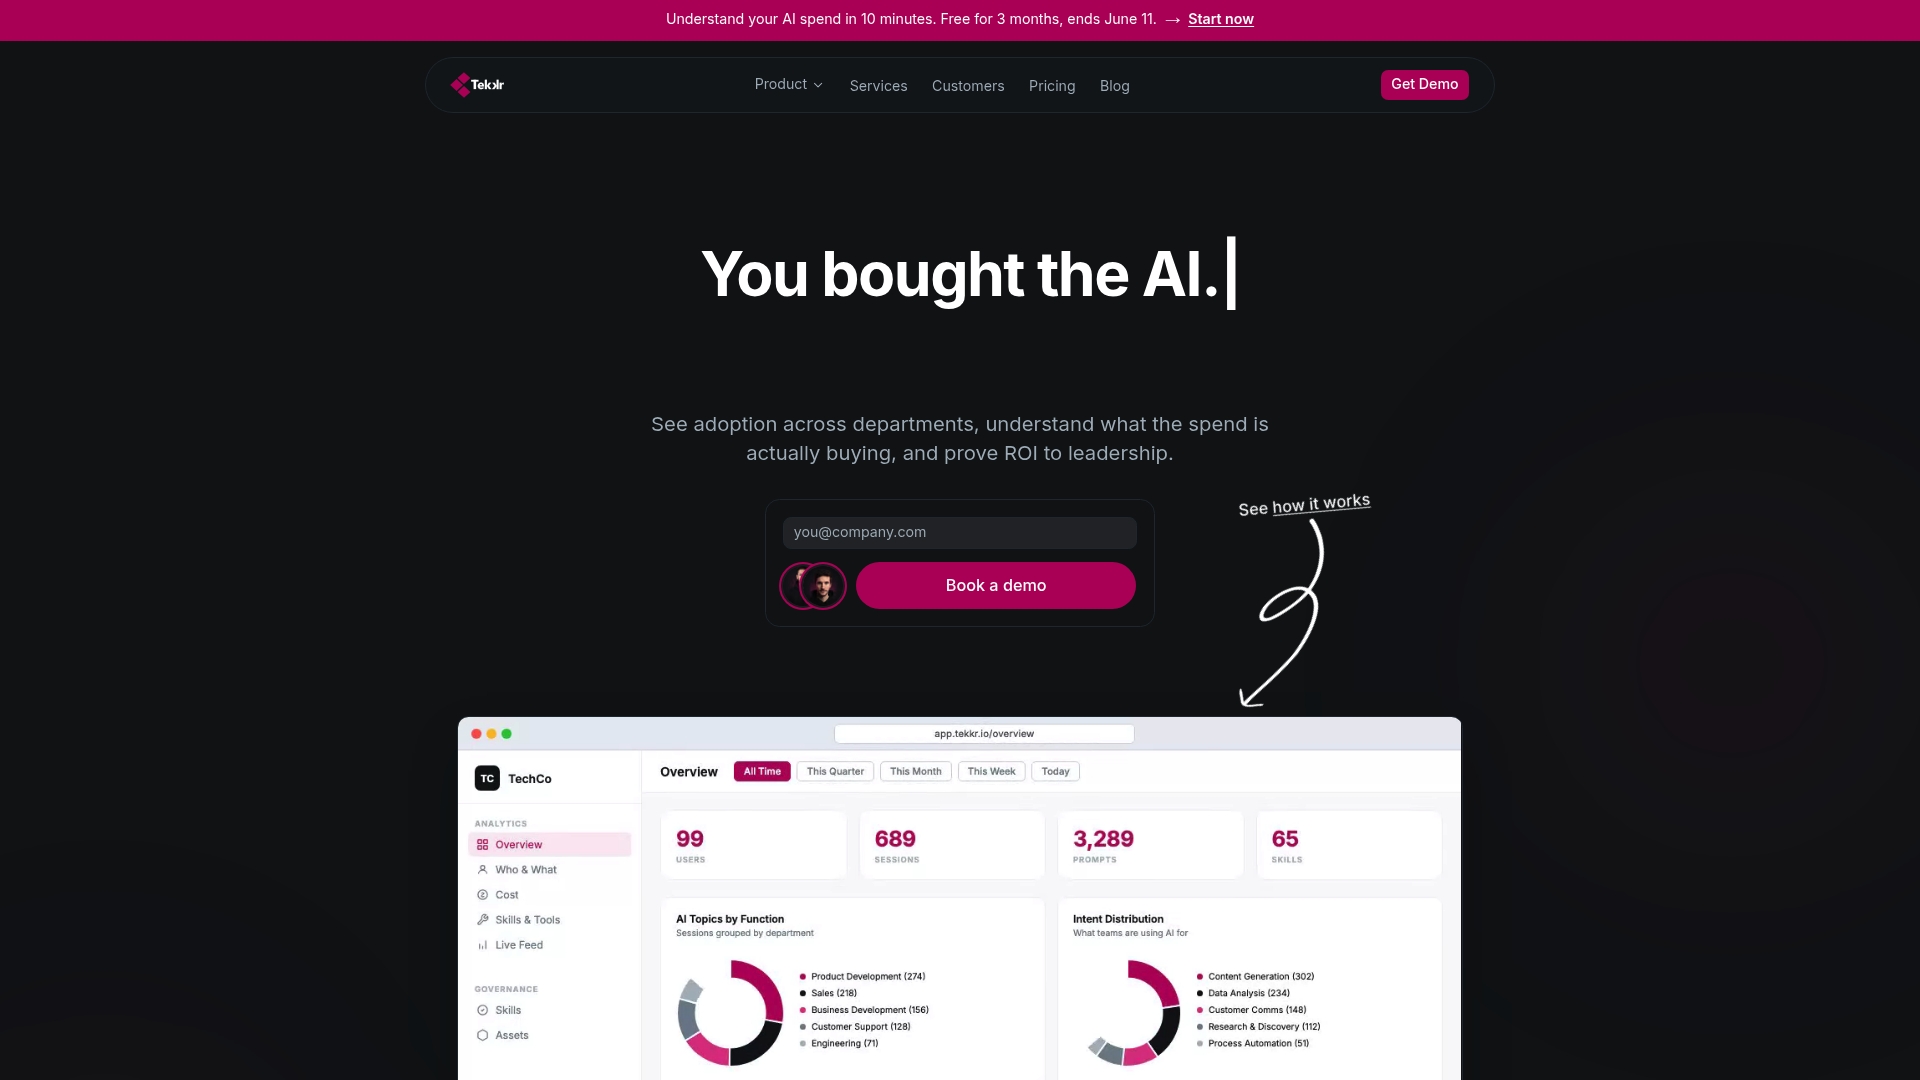
Rather than asking you to commit to a full rollout before you’ve seen a single real number, this approach starts with a focused observability pilot, the same 30-day scoping window this article recommends, so you can validate signal quality before scaling tagging and reporting company-wide. Setup runs about 10 minutes, and a free tier means you can see your first usage and spend breakdown without a procurement cycle attached.
If your organization is past the pilot stage and needs a structured rollout, Tekkr’s AI adoption and consulting services pair the Configurato platform with hands-on support for governance, playbooks, and enablement. Check current plans and pricing to see which tier fits your team size, or start directly on the Configurato product page to get your first showback report running this quarter.
Sources
A handful of standards and studies come up repeatedly when building or defending a showback program:
- 2025 AI Adoption Report: Gen AI Fast-Tracks Into the Enterprise - Knowledge at Wharton
- NIST AI Risk Management Framework (AI RMF) — Measure guidance
- ISG: State of enterprise AI adoption report 2025
- The state of AI: How organizations are rewiring to capture value — McKinsey (2025)
FAQ
What Is AI Showback Reporting?
AI showback reporting measures and displays an organization’s AI tool usage, spending, and return by team and use case, without billing anyone internally. It’s a visibility tool, distinct from cloud FinOps showback, which tracks data-center and cloud resource costs.
How Is Showback Different From Chargeback?
Showback is informational: it shows teams and executives what’s being spent and used, with no money actually moving between budgets. Chargeback actively bills a department’s budget for its usage, which most AI programs avoid early on because it discourages the experimentation adoption depends on.
What Metrics Matter Most in an AI Showback Report?
Prioritize usage (active users, adoption rate), spend (cost per user, cost per provider), and outcomes (time saved, throughput change). McKinsey’s research found tracking well-defined KPIs tied to workflows is among the practices most correlated with real bottom-line impact, according to McKinsey’s 2025 findings.
How Long Does It Take to Set Up Showback Reporting?
A scoped pilot on two or three tools typically takes about 30 days to produce a usable first report, covering instrumentation, data collection, and an initial ROI proxy. Full enterprise-wide rollout depends on tool count and data source complexity, but starting narrow avoids the multi-quarter delays that stall broader efforts.
Does Tekkr Offer a Showback Reporting Tool?
Yes. Tekkr’s Configurato platform tracks AI usage and spend by team and use case with privacy-first, end-to-end encrypted architecture and automatic PII stripping, and setup takes about 10 minutes with a free tier available. Current pricing and plan details are listed on Tekkr’s pricing page.