
AI experiment tracking, in the enterprise sense, is the discipline of measuring who uses AI tools, what they cost by team, and what value they produce, so finance can attribute spend and leadership can justify or kill an investment. It’s not a research log of model runs. Done right, it gives CFOs and transformation leaders a traceable line from a Claude or Codex license to actual dollars saved or earned, backed by tools like Configurato that build that line automatically.
TL;DR:
- Tag requests with team, workflow, and model metadata at the source to enable precise streaming attribution and avoid unresolved invoices.
- Track soft metrics such as adoption rate, cycle time reduction, and suggestion acceptance to gauge early signals of ROI movement.
- Establish pre-defined thresholds for adoption, accuracy, and cost ceilings before starting experiments to ensure valid measurement and prevent false claims.
- Incorporate experiment tracking into CI/CD pipelines by setting deployment gate checks that compare current and baseline metrics automatically.
- Use structured, searchable logs with filtering by team, workflow, and outcome to quickly identify issues or spikes in AI spend, enabling reactive cost management.
Table of Contents
- What key metrics should finance and transformation leaders track?
- How do you instrument experiments so spend is attributable?
- How do you avoid false ROI claims?
- Who should own AI ROI, and how does reporting work?
- When should you tighten financial scrutiny as pilots scale?
- What’s a practical 30 to 90 day rollout checklist?
- Best practices for versioning code, data, and model snapshots
- How do you organize and search experiment logs at scale?
- How should you visualize experiment performance over time?
- How does experiment tracking fit into CI/CD pipelines?
- How do you address reproducibility and data leakage risks?
- TekkrTools perspective: what actually works in practice
- Getting from spend visibility to real ROI with Configurato
- Sources
- FAQ
What key metrics should finance and transformation leaders track?
Hard metrics are the ones a CFO can put in a spreadsheet without an asterisk. Cost per request, FTE hours saved, revenue uplift per rep, and cost per transaction all convert directly into dollars. You calculate cost per request by dividing total model spend for a workflow by request volume over the same period. FTE hours saved comes from multiplying the reduction in task time by loaded hourly cost, then multiplying by frequency.
Soft metrics matter just as much, even though they resist a clean formula. Adoption rate, cycle time reduction, and employee satisfaction explain why the hard numbers move, and they’re the earliest signal you get.
- Adoption rate: percentage of licensed users active in a rolling 30 day window
- Cycle time reduction: median time from task start to completion, before and after
- Accepted suggestion rate: how often an AI recommendation is used unmodified
Enterprises that separate pilot ROI from scaled ROI often see a measurable return within 9 to 15 months of full deployment, depending on the use case category. Track your own metrics for AI success from week one rather than reconstructing them later from invoices.
How do you instrument experiments so spend is attributable?
You can’t attribute what you didn’t tag at the source. Most organizations discover this the hard way: they get a monthly AI bill with a total and no way to explain it. Many companies genuinely cannot trace AI spend back to the workflows or teams that generated it, which makes optimizing that spend close to impossible.
Fixing this starts with metadata captured at the request level, not reconstructed after the fact:
- Team and cost center ID, attached at the API call, not inferred later
- Workflow or feature identifier, so a support macro is distinguishable from a code review
- Model and token count, since pricing varies wildly between models
- Customer or case ID, when the request ties to a specific deal or ticket
- Timestamp and latency, useful for both cost and performance debugging
Streaming attribution beats monthly reconciliation because it catches problems while they’re still cheap to fix. A model misconfiguration that burns 10,000 extra tokens an hour is a rounding error if caught in real time and a five-figure surprise if caught at month end. FinOps practitioners consistently name tracing requests and controlling token cost as the top unresolved concern in enterprise AI spend, which is exactly the gap real-time alerting closes.
Guardrails matter as much as visibility; you can follow practical governance and rollout practices that make experiments auditable and traceable with the Enterprise Generative AI Governance Playbook, NIST/AWS/Microsoft Aligned. Set rate limits per team, cap retries on failed calls (a silent cost multiplier), and enforce model-selection rules so nobody defaults to the most expensive option for a task a cheaper model handles fine. Route the resulting event stream into a warehouse your BI team already trusts, whether that’s Snowflake, BigQuery, or a similar surface, so cost data lives next to revenue data instead of in a separate silo.
Pro Tip: Set a cost-per-request alert threshold before launch, not after the first budget overrun. Waiting until spend looks wrong means you’ve already lost weeks of unattributed cost.
How do you avoid false ROI claims?
The uncomfortable truth is that most AI ROI numbers presented to leadership wouldn’t survive an audit. Fewer than 30% of organizations establish the pre and post baseline with a control group that CFOs actually need to separate AI-driven lift from normal business fluctuation. Without that baseline, a productivity gain could just as easily be seasonal, or the result of an unrelated process change.
A defensible measurement plan needs explicit thresholds set before the experiment starts, not backfilled once results look good:
- Adoption floor: minimum percentage of the target group actively using the tool by a set date
- Accuracy floor: minimum acceptable output quality, measured against a human baseline
- Unit cost ceiling: the maximum acceptable cost per request or per transaction before the case no longer pencils out
Apply lighter tracking to early, exploratory experiments and save the rigorous holdout design for anything moving toward company-wide scale. A one-sentence hypothesis like “using an AI assistant for first-draft contract review cuts legal team turnaround time by 20% without increasing error rate” gives you a testable claim with a built-in kill criterion baked in from day one.
Who should own AI ROI, and how does reporting work?
Accountability for AI ROI tends to get scattered across finance, IT, and operations, with nobody actually holding the number. Forbes has documented this pattern directly, noting that AI-driven output rarely shows up cleanly in the accounts that are supposed to track it, leaving a gap between what AI is doing and what the ledger says.
A workable split looks like this:
- Finance translates raw usage activity into dollar figures and owns the confidence bounds on those figures
- Product and engineering own instrumentation, meaning the tagging and metadata discussed above
- Operations enforces the guardrails and rate limits that keep cost from drifting
- Transformation owns adoption, training spend, and change management
| Report Element | What It Shows |
|---|---|
| Baseline | Pre-AI performance on the target metric |
| Delta | Measured change since rollout |
| Confidence bounds | Range accounting for measurement uncertainty |
| Recommended action | Scale, hold, or kill |
Naming a single accountable owner, rather than leaving ROI to a committee, is what separates programs that report clean numbers from ones that keep explaining discrepancies. Our guide to measuring AI ROI covers how to build the deck finance actually wants to see.
When should you tighten financial scrutiny as pilots scale?
A three-stage model keeps measurement effort proportional to financial exposure. Pilot-stage experiments get lightweight tracking: adoption and basic sentiment, checked weekly. Coordinated rollouts across multiple teams need real cost attribution and a defined control group. Portfolio-stage deployments, the ones touching revenue or core operations, need the full baseline, holdout, and NPV/IRR treatment a capital allocation committee would expect from any other investment.
- Pilot (weeks 1 to 6): track adoption and qualitative feedback, minimal financial modeling
- Coordinated (months 2 to 4): add cost attribution, a matched control group, and a documented kill gate
- Portfolio (month 5 onward): apply NPV/IRR where capital outlay is significant, and report quarterly to finance
Scaling reveals hidden costs pilots never show: integration engineering, ongoing model tuning, and the support burden of a larger user base. Budget for these before they show up as a surprise line item. Track pilot-to-production conversion rate, time-to-production, and reuse rate across use cases, since a use case that gets rebuilt from scratch every time is quietly expensive. Industry guidance backs applying lighter tracking early and rigorous scrutiny at scale as the difference between programs that stall and ones that compound.
What’s a practical 30 to 90 day rollout checklist?
Visibility doesn’t require a six-month build. It requires sequencing.
- Days 1 to 30: tag every request by team and workflow, stand up a basic dashboard, define your first adoption cohort, and brief leadership on what you’ll report and when
- Days 31 to 60: tighten attribution to the request level, run a first pre/post comparison against a control group, and set explicit kill gates for underperforming pilots
- Days 61 to 90: scale instrumentation to remaining teams, refine the financial translation model, and present a CFO-ready business case for expansion
Adoption lift rarely happens on its own. Gamified rollouts, where teams see usage leaderboards, and shared playbooks documenting what worked for the first cohort, both meaningfully shorten the gap between “tool is available” and “tool is actually used.” Enterprises that budget explicitly for change management alongside the technology sidestep the most common failure mode: a system that works fine technically but that nobody bothers opening.
Pro Tip: Publish the first adoption cohort’s results internally, even if they’re modest. A visible early win does more for rollout speed than a perfect dashboard nobody has seen yet.
Our 30 day AI use case analytics playbook walks through this exact sequencing in more detail.
Best practices for versioning code, data, and model snapshots
Enterprise AI tracking still needs version discipline, even outside a research context. When a workflow’s output quality shifts, you need to know whether the prompt changed, the underlying model updated, or the data feeding it drifted. Skipping this makes every anomaly a mystery.
Treat three things as versioned artifacts: the prompt or configuration logic, any reference data the workflow depends on, and the model identifier itself, including the exact provider version string. A model labeled generically as “Claude” or “GPT” without a specific version tag is not a usable audit trail. When a vendor pushes a silent model update, and this happens more often than most teams expect, your cost and quality metrics can shift for reasons that have nothing to do with your own changes.
Store configuration changes in the same version control system your engineering team already uses, tagged with a timestamp and the business justification for the change. “We’re not sure” is not.
For teams running structured evaluations, snapshotting the evaluation dataset alongside the model version prevents a subtle problem: comparing this month’s results against a dataset that quietly changed since last month, which makes performance look better or worse than reality. Tekkr’s evaluation and testing approach treats this pairing as a baseline requirement, not an afterthought.
How do you organize and search experiment logs at scale?
A single team running one AI workflow can track everything in a spreadsheet. An enterprise running AI across a dozen departments cannot, and trying to is how attribution breaks down in the first place.
The fix is a consistent tagging taxonomy applied at ingestion, not after the fact. Every logged event should carry team, workflow, model, and outcome fields as structured metadata, searchable independently rather than buried in free text notes. This sounds obvious until you look at how most organizations actually log AI usage: as unstructured chat exports or scattered spreadsheets that nobody can filter by anything more specific than date.
Three filtering dimensions cover most enterprise questions:
- By team or cost center, to answer “what is marketing spending on AI this month”
- By workflow or use case, to answer “is the contract review assistant actually saving time”
- By outcome or status, to answer “how many requests failed, were overridden, or triggered an escalation”
Searchability matters most when something goes wrong. If cost spikes on a Tuesday, you need to filter to that day, that team, and that model within minutes, not after pulling three people into a war room to reconstruct what happened from raw logs. Structured, filterable logs are what make that a five-minute lookup instead of a half-day investigation.
How should you visualize experiment performance over time?
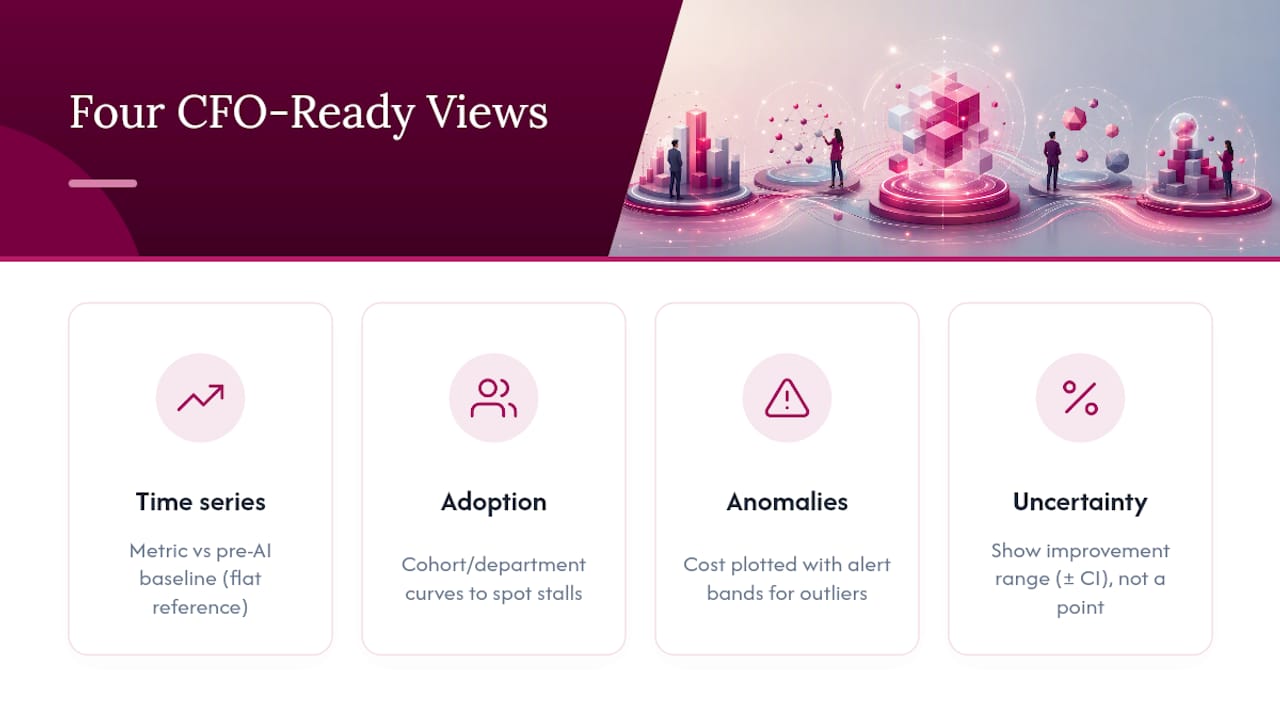
A single dashboard number, like total AI spend for the month, tells you almost nothing useful on its own. What matters is the trend line against a baseline, and whether that trend correlates with the adoption curve driving it.
Three chart types cover the vast majority of what finance and transformation leaders actually need to see:
Time series with baseline overlay shows the metric you care about, cost per request or cycle time, plotted against its pre-AI baseline as a flat reference line. This is the single most useful chart in the entire measurement stack, because it visually answers “is this actually working” in one glance.
Adoption curves segmented by cohort show usage climbing (or stalling) by department or rollout wave, which tells you whether a slow overall adoption number is a company-wide problem or one team dragging the average down.
Cost anomaly charts with alert bands flag spend that breaks outside an expected range, which is far more actionable than a raw spend total that only tells you something is high, not why.
Confidence intervals belong on these charts, not just the headline number. CFOs and finance leaders consistently prefer a range with visible uncertainty over a single clean number that implies more precision than the underlying data supports. A chart showing “12% improvement, plus or minus 4 points” is more trustworthy, and more defensible in a budget review, than “12% improvement” stated flat.
How does experiment tracking fit into CI/CD pipelines?
AI-powered features increasingly ship through the same CI/CD pipeline as everything else, which means experiment tracking needs a hook into that pipeline rather than living in a separate system nobody checks.
The practical integration point is the deployment gate. Before a prompt change, model swap, or workflow update ships to production, an automated check should compare the new version’s evaluation metrics against the current baseline. If accuracy drops below the floor set in your kill criteria, or cost per request exceeds the ceiling, the pipeline should block the deploy the same way a failing unit test would.
This does two things at once. It catches regressions before they hit real users, and it creates an automatic audit trail linking every production change to a measured before/after comparison, which is exactly the evidence finance needs when reviewing quarterly AI spend. Without this link, teams end up debugging cost or quality regressions weeks after they shipped, guessing at which of several recent changes caused the problem.
Logging should also capture the deployment event itself as metadata: which commit, which model version, which evaluation run approved it. That turns your version control history and your cost dashboard into the same story instead of two disconnected systems that require manual reconciliation every time someone asks a hard question about why performance changed.
How do you address reproducibility and data leakage risks?
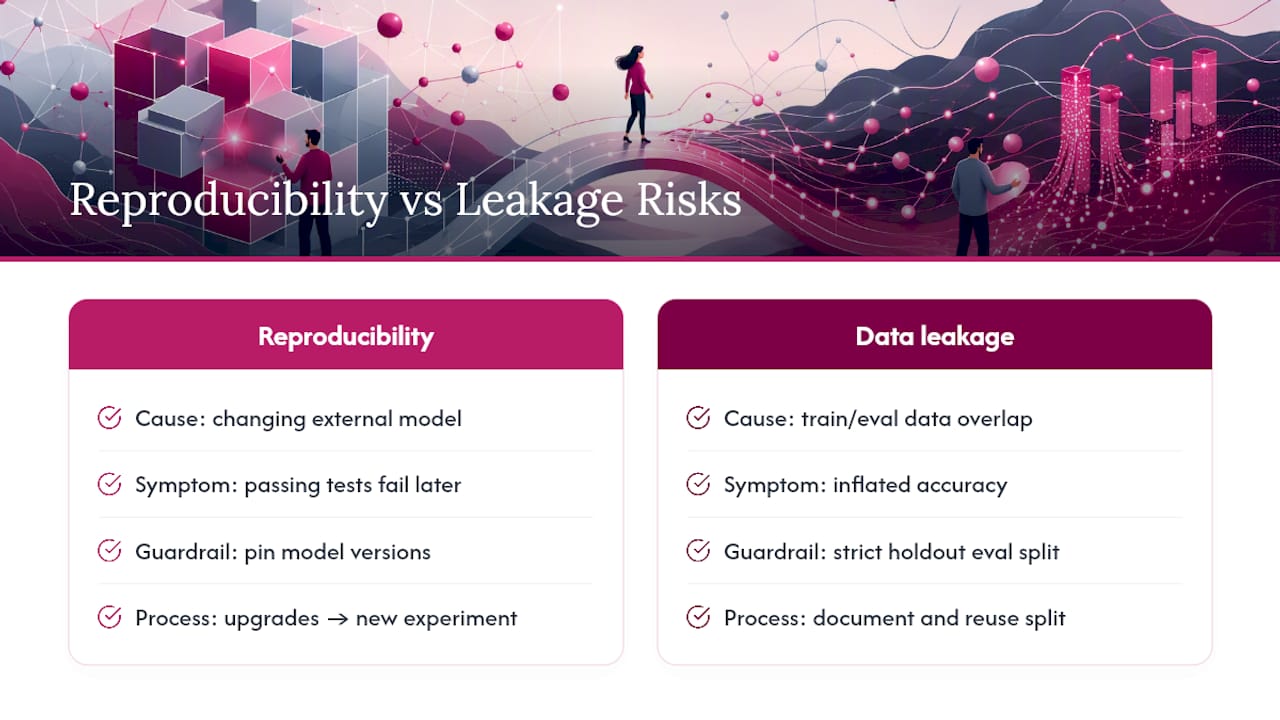
Two failure modes quietly undermine enterprise AI tracking more than any other: results that can’t be reproduced, and evaluation data that leaked into what the model was trained or tuned on.
Reproducibility breaks down when a workflow depends on an external model that changes without notice. If a vendor updates a model behind the same version label, a test that passed last month can fail today for reasons that have nothing to do with your own code. The fix is pinning to specific model versions wherever the provider allows it, and treating any forced upgrade as a new experiment requiring its own baseline comparison rather than an in-place update.
Data leakage in an enterprise context usually looks different from a research lab. It shows up when the same customer interactions used to build a prompt or fine-tune a workflow also appear in the dataset used to evaluate it, inflating the measured success rate. A support workflow evaluated on tickets the underlying model effectively “saw” during setup will look far more accurate than it will perform on genuinely new tickets next month.
The practical guardrail is a strict split: evaluation data must be held out from anything used to configure, tune, or prompt-engineer the workflow, and that split needs to be documented and reused for every subsequent comparison. Skipping this step is how a pilot posts a 95% accuracy rate internally and then disappoints everyone once it meets real, unseen traffic.
TekkrTools perspective: what actually works in practice
Most AI ROI failures aren’t measurement failures. They’re ownership failures. Someone runs a solid pilot, gets a real number, and then the tracking stops the moment the pilot ends, because nobody was assigned to keep watching after launch.
Privacy-first instrumentation matters more than most leaders assume going in, particularly because employees notice, and resist, tools that feel like surveillance. Configurato’s approach, built around end-to-end encryption and automatic PII stripping, targets adoption without the trust cost that a heavier-handed monitoring tool creates.
The setup speed claim sounds like a marketing line until you consider the alternative: most instrumentation projects stall for months waiting on engineering bandwidth. A tool that removes that excuse changes how fast an organization can even start collecting the baseline it needs.
— TekkrTools
Getting from spend visibility to real ROI with Configurato
Most AI adoption tracking today runs on spreadsheets stitched together from invoice totals, which tells you what you spent, not what it produced or who actually used it. Configurato takes a different route: it measures adoption and spend by team automatically, breaks down which use cases are pulling their weight, and drives adoption higher through gamified rollouts and shared playbooks rather than leaving that up to chance.
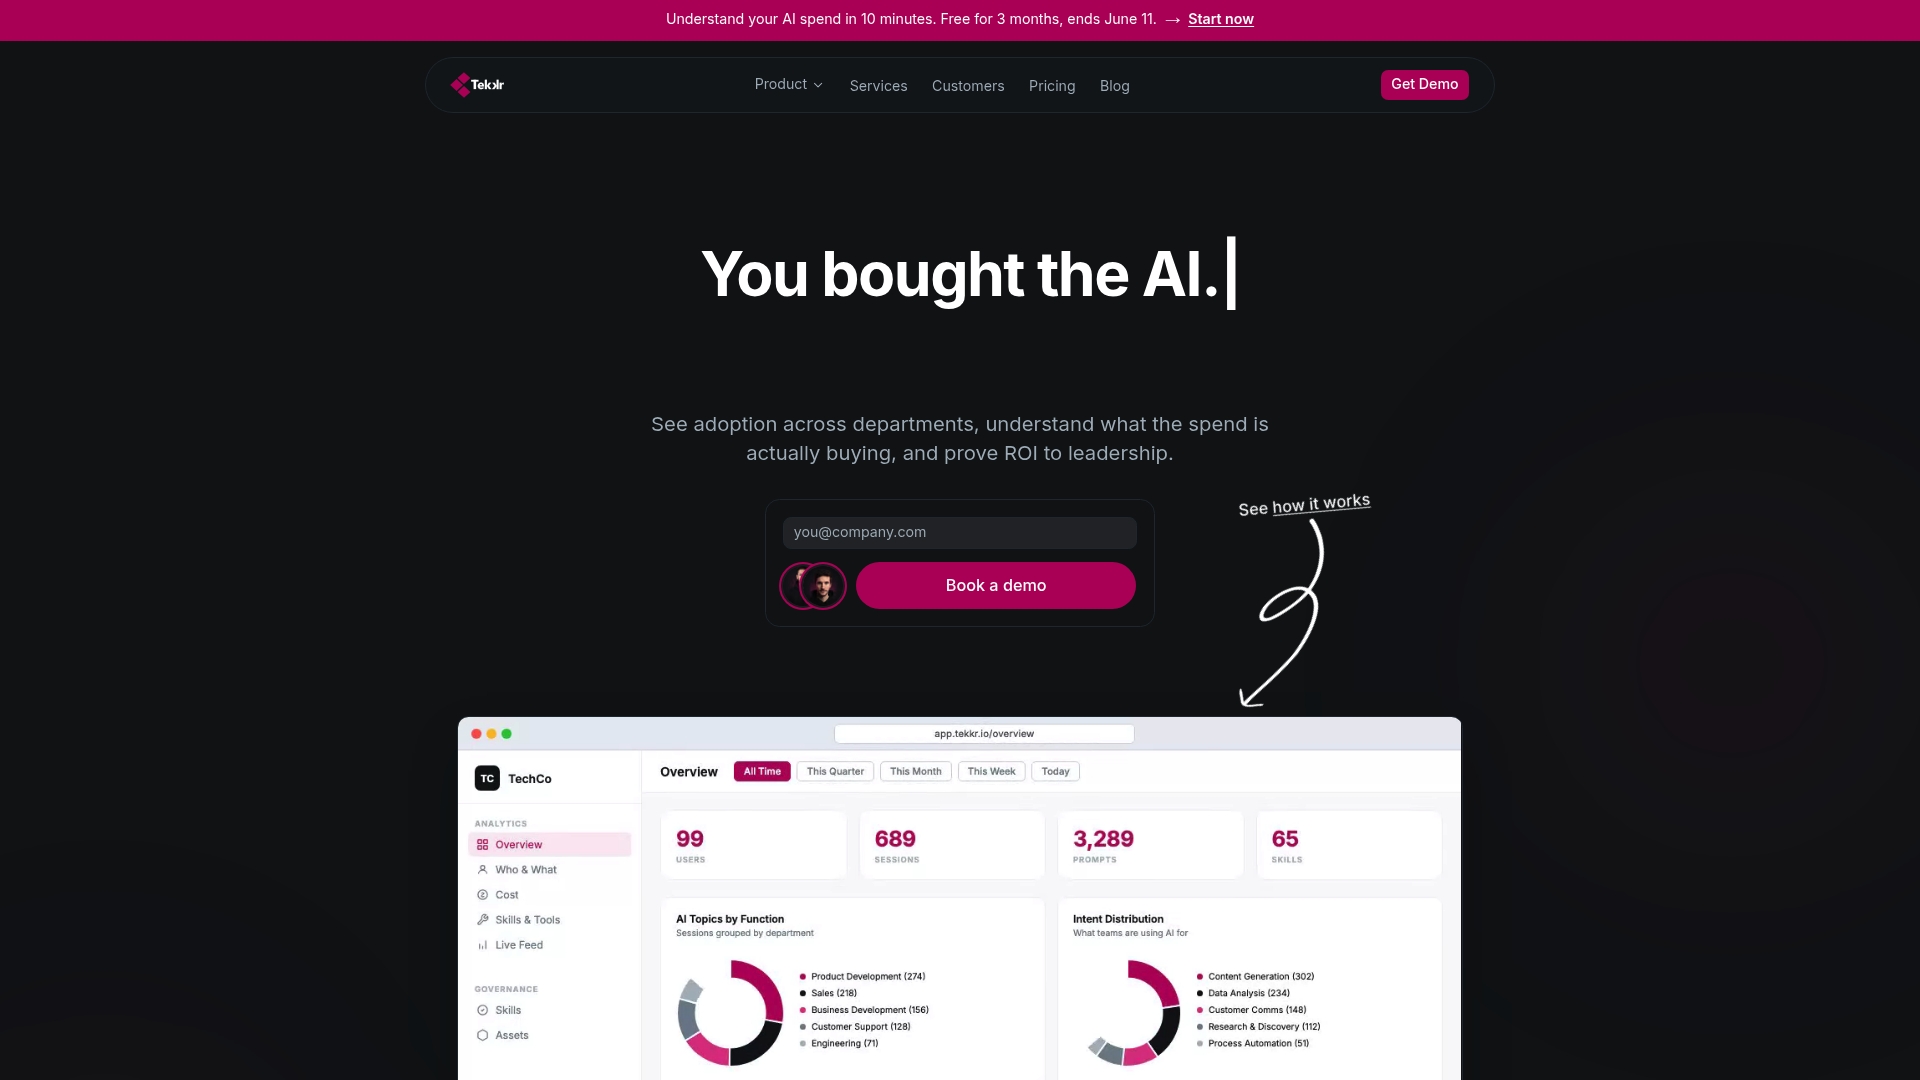
Setup takes minutes with no browser extensions required, and there’s a free tier with no credit card needed to start seeing where AI spend is actually going. The privacy-first, GDPR-compliant architecture strips PII automatically, so you get visibility without asking employees to trade away privacy for it. If your organization needs hands-on support building the rollout strategy around it, Tekkr’s AI adoption programs pair the software with an operator who has run this before.
Check current pricing and plans or explore Configurato directly to see what request-level visibility looks like for your own teams.
Sources
- Scaling AI results: strategies (MIT Sloan Management Review)
- Nobody knows where their AI budget is going (CIO)
FAQ
What is AI experiment tracking in an enterprise context?
It’s the practice of measuring who uses AI tools, what they cost by team, and what financial value they generate, so leadership can attribute spend and justify continued investment. It’s distinct from logging model training runs, which is a separate engineering discipline.
How do you attribute AI spend to specific teams?
You tag every request with team, workflow, and model metadata at the point of use, then stream that data into a cost dashboard rather than waiting for monthly invoices. Without this, most organizations cannot trace spend back to the workflow that caused it.
What are good adoption thresholds to set for a pilot?
Set the exact floor before launch, along with an accuracy floor and a cost ceiling, so the kill decision is objective rather than political.
Does Tekkr’s Configurato handle spend and adoption tracking?
Yes. Configurato measures AI adoption and spend by team, surfaces use-case performance, and drives adoption through gamified rollouts, all within a privacy-first, GDPR-compliant setup that takes about 10 minutes to configure. Current pricing details are available on the Tekkr pricing page.
How long until AI investments show measurable ROI?
Top enterprise adopters typically see measurable ROI within 9 to 15 months of full deployment, depending on the use case category. Pilots should show early adoption and directional signal within the first 60 to 90 days, well before that full ROI figure materializes.