
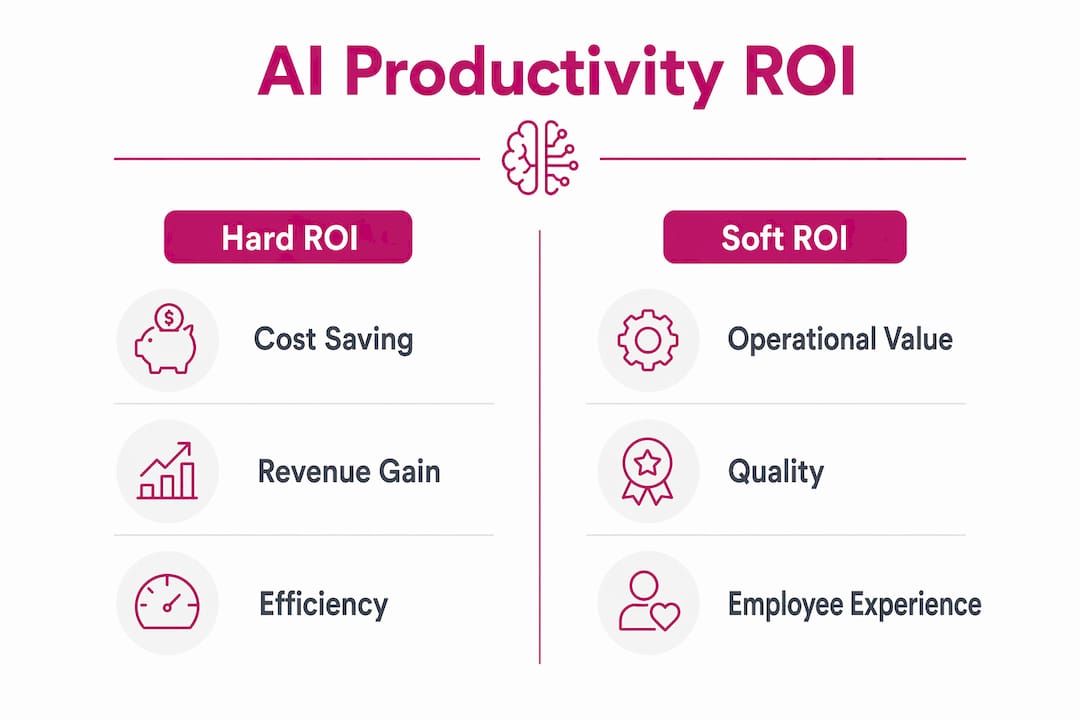
AI productivity ROI is defined as the financial and operational value an organization realizes from AI investments relative to the total costs of those investments, including infrastructure, licensing, talent, and data preparation. Most executives treat it as a single number, but it splits into two distinct categories: hard ROI, which covers cost savings and revenue impact, and soft ROI, which covers productivity gains, decision quality, and employee output. Getting this distinction right determines whether your board approves the next round of AI spending. Deloitte’s 2025 survey found 85% of executives increased AI investment, yet typical payback takes 2–4 years, and only 6% see returns under one year. That gap between spending and return is exactly why rigorous measurement matters.
What is AI productivity ROI and how is it measured?
The standard industry term for this discipline is AI return on investment, often calculated using frameworks like Total Economic Impact (TEI), Net Present Value (NPV), and Productivity Multiplier Models. Each framework serves a different purpose. TEI, developed by Forrester, captures both quantitative savings and qualitative benefits like risk reduction. NPV discounts future cash flows to present value, making it the preferred tool for CFOs comparing AI projects against other capital investments. Productivity Multiplier Models estimate how much output increases per dollar of AI spend.
Hard metrics form the backbone of any credible AI ROI calculation. Typical financial metrics include FTEs avoided, cycle time saved, revenue per feature shipped, error rate reduction, and cost per team member. Soft metrics, including NPS improvements, decision quality, and time-to-market acceleration, often go missing from formal ROI models entirely. That omission understates the full return and weakens the business case.

Time horizons vary significantly by AI type. Copilot tools show measurable productivity gains in 60–90 days. Cost-reduction automation projects reach positive ROI in 9–15 months. Infrastructure-level AI investments require 18–30 months to turn cash-flow positive. Knowing which category your initiative falls into prevents premature conclusions about whether the investment is working.
Pro Tip: Set your measurement framework before deployment, not after. Choosing TEI or NPV retroactively forces you to reconstruct assumptions that should have been documented from day one.
How do organizations calculate an AI productivity baseline?
Without a pre-deployment baseline, ROI metrics are fabricated, not reported. This is the most common and most damaging mistake executives make when measuring AI productivity gains. A baseline captures the time, cost, and quality of a workflow before AI touches it. Without that anchor, any post-deployment improvement number is a guess dressed up as data.
Building a solid baseline requires measuring four dimensions before launch:
- Output volume: How many units, tasks, or cases does the team complete per week?
- Time input: How many hours does each workflow consume per unit of output?
- Quality rate: What is the error rate, rework rate, or defect rate at current performance?
- Cost per unit: What does it cost to produce one unit of output at current staffing and tooling?
Balanced scorecard approaches that track all four dimensions prevent AI metrics from masking true operational performance. A team that produces twice the volume with twice the error rate has not improved. Single-metric baselines hide that reality.
The organizations that overstate AI benefits most often are those that measured only speed. A legal team that drafts contracts 40% faster but produces documents requiring 60% more revision cycles has not gained productivity. It has shifted the bottleneck downstream.
Pro Tip: Run a control group alongside your AI-enabled team for the first 90 days. Even a small group of five to ten people doing the same work without AI gives you a live comparison that no retroactive calculation can replicate.
What are the typical timelines and return expectations?
Return expectations for AI investments follow a clear pattern once you categorize projects correctly. CFOs who separate ROI into cost-reduction and revenue-generation buckets accelerate investment decisions by 40%. The categorization forces clarity about what success looks like and when to expect it.
The timeline picture for most enterprises is sobering. Median enterprise AI projects require 18–24 months to reach cash-flow positive. The majority of payback periods land in the 2–4 year range. Productivity gains only become visible at the organizational level when adoption exceeds 60% of the target team. Below that threshold, individual gains get diluted by the majority who are not yet using the tools consistently.
Top-quartile AI adopters generate 3–5x returns versus median performers. The difference is not the technology. Change management explains most of the payback gap between organizations using identical tools. Teams with structured rollouts, clear use-case playbooks, and active adoption monitoring outperform teams that simply license a tool and expect behavior to change.
The practical implication for executives: treat AI adoption rate as a leading financial indicator. If adoption sits below 60% at the 90-day mark, the ROI timeline extends automatically. Tracking adoption is not an HR metric. It is a financial forecast input.
What are common misconceptions about AI productivity ROI?
The most consequential misconception is that productivity gains translate directly into competitive advantage. McKinsey’s 2026 analysis frames AI as a competitive reset rather than a productivity revolution. When every competitor adopts the same tools, productivity gains raise the industry floor without expanding any individual firm’s profit pool. The winners are those who use AI to reshape their business model, not just their task completion rate.
A second misconception involves the gap between leading and lagging indicators. Frequent AI users save over 9 hours weekly, which sounds compelling. Boards, however, approve budgets based on revenue impact, not hours saved. Time saved is a leading indicator. Revenue impact is the lagging indicator that actually justifies the spend.
The coding productivity example makes this concrete. A 180% increase in code commits yields only 30% more shipped releases. The gap exists because bottlenecks in code review, QA, and deployment pipelines absorb the upstream speed gain. Linear extrapolations from task-level metrics consistently overstate business impact.
| Category | Hard ROI | Soft ROI |
|---|---|---|
| Definition | Measurable financial return | Operational and qualitative improvement |
| Examples | FTEs avoided, cost savings, revenue uplift | Decision quality, employee output, NPS |
| Board approval | Primary justification | Supporting evidence |
| Measurement difficulty | Moderate to high | High |
| Typical challenge | Attribution to AI specifically | Quantifying in dollar terms |
How can executives measure and maximize AI productivity ROI?
The first requirement is matching your measurement framework to your AI type. 86% of AI leaders use different ROI frameworks for generative AI versus agentic AI. Generative AI tools, like writing assistants and code copilots, deliver efficiency gains measured in hours saved and error rates. Agentic AI, which executes multi-step processes autonomously, demands process redesign metrics and longer measurement horizons. Applying a single framework to both types produces numbers that mislead rather than inform.
Practical KPIs worth tracking across most AI initiatives include:
- FTEs avoided: Headcount that would have been required without AI, calculated against actual output growth
- Cycle time improvement: Reduction in end-to-end process time, measured from intake to delivery
- Margin uplift: Revenue growth that outpaces cost growth, attributable to AI-enabled capacity
- Customer satisfaction scores: NPS or CSAT changes correlated with AI-assisted interactions
- Adoption rate by team: Percentage of target users actively engaging with AI tools weekly
Ongoing monitoring requires more than a quarterly dashboard. Measuring enterprise AI productivity gains accurately means tracking adoption at the team level, not just the license level. A tool with 500 seats and 200 active users is not a 500-seat investment. It is a 200-seat investment with 300 seats of waste.
The executives who extract the most value from AI treat it as a competitive positioning tool, not a cost-cutting exercise. That framing changes which metrics matter and which initiatives get funded.
Key Takeaways
Measuring AI productivity ROI requires hard financial metrics, pre-deployment baselines, and adoption tracking, because without all three, reported returns are unreliable.
| Point | Details |
|---|---|
| Define ROI in two buckets | Separate hard ROI (cost, revenue) from soft ROI (productivity, quality) before setting targets. |
| Baseline before deployment | Measure output volume, time, quality, and cost per unit before AI launches or the comparison is meaningless. |
| Match framework to AI type | Use efficiency models for generative AI and process redesign models for agentic AI to avoid misestimation. |
| Adoption drives returns | Productivity gains only appear at the organizational level when adoption exceeds 60% of the target team. |
| Time saved needs revenue linkage | Hours saved sustains implementation, but boards require revenue impact for budget justification. |
The measurement trap most executives fall into
The most common mistake I see is organizations declaring AI ROI success based on a single metric, usually time saved, without ever connecting it to a financial outcome. A team that saves 9 hours per person per week has generated a real operational gain. But if that time flows into lower-priority work rather than higher-margin output, the board sees nothing. The metric looks good. The P&L does not move.
Rigorous baseline data is the only defense against this trap. Without it, you cannot prove that AI caused the improvement, and you cannot prove it did not. That ambiguity is exactly what skeptical CFOs exploit to cut AI budgets in the next planning cycle.
The other pattern worth naming: executives who treat AI ROI as a one-year story. The data is clear that most enterprise AI investments take 2–4 years to pay back. Organizations that pull the plug at 18 months because the numbers are not yet compelling are abandoning investments that were on track. Patience is not a soft skill here. It is a financial discipline grounded in realistic payback modeling.
AI’s deepest value is not efficiency. It is the ability to reshape how your business operates at a structural level. The executives who understand that distinction build durable competitive positions. The ones who chase short-term time-saved metrics end up with a productivity tool that their competitors matched six months later.
— TekkrTools
How Tekkr helps organizations prove AI is working
Most organizations buy AI tools and then struggle to show the board what they got for the money. Tekkr exists to close that gap.
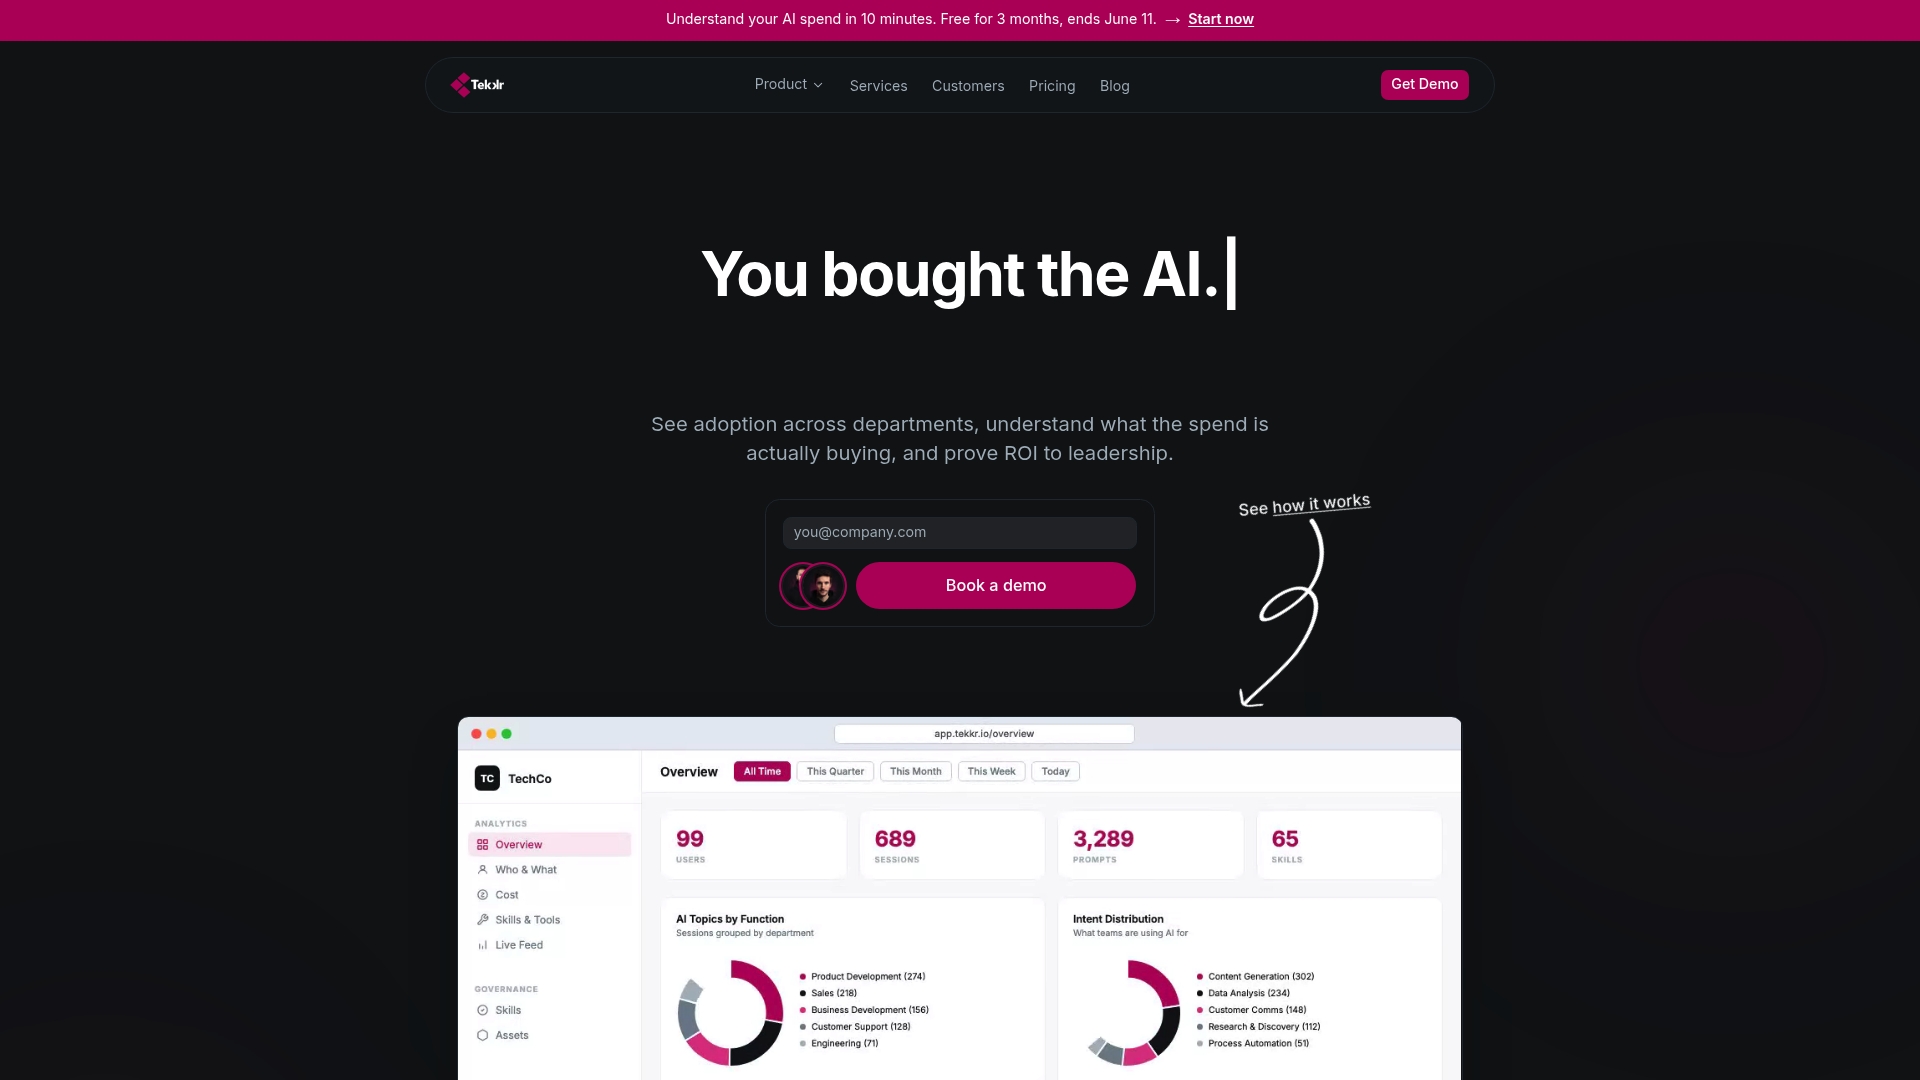
Tekkr’s platform, Configurato, tracks AI adoption, spend, and return across every team in your organization. It shows who is actively using tools like Claude and Codex, breaks down costs by department, and surfaces which use cases are generating real output gains. Gamified rollouts and company-wide AI playbooks push adoption above the 60% threshold where productivity gains actually become visible. Setup takes about 10 minutes, with a free tier and no credit card required. If you are ready to move from AI spend to proven AI results, Tekkr gives you the measurement infrastructure to do it.
FAQ
What is AI productivity ROI?
AI productivity ROI measures the financial and operational value an organization realizes from AI investments relative to total costs, including infrastructure, licensing, talent, and data. It splits into hard ROI (cost savings, revenue impact) and soft ROI (productivity gains, decision quality).
How do I calculate an AI productivity baseline?
Measure output volume, time per task, quality rate, and cost per unit before deploying AI. Without this pre-deployment snapshot, post-deployment improvement numbers have no credible reference point.
How long does it take to see AI ROI?
Copilot tools show gains in 60–90 days, cost-reduction automation in 9–15 months, and infrastructure-level AI in 18–30 months. Most enterprise AI investments reach full payback in 2–4 years.
Why do AI productivity gains sometimes not show up in financial results?
Task-level gains often get absorbed by downstream bottlenecks. A 180% increase in code commits, for example, produces only 30% more shipped releases because review and deployment pipelines constrain output. Measuring only upstream activity overstates business impact.
What adoption rate is needed for AI productivity gains to appear?
Organizational-level productivity gains require adoption above 60% of the target team. Below that threshold, individual gains are diluted by the majority who are not yet using AI tools consistently.