
AI productivity benchmarks for growth-stage companies are defined by AI maturity stage, not company size or tool count. Executives who apply the wrong metrics to the wrong stage routinely kill programs that were actually working. The core principle is simple: early-stage companies measure time recovered per knowledge worker, while later stages track throughput, cost-to-serve, and compounding improvement rates. Getting this right separates companies that prove AI value from those that cancel subscriptions after six months.
1. What are the main AI productivity benchmarks by maturity stage?
The most common mistake in AI productivity benchmarking is applying Stage 3 ROI expectations to Stage 1 implementations. Stage mismatch is the single most critical benchmarking error, and it leads directly to premature program termination.
Each maturity stage has its own valid metrics:
- Stage 1 (Exploring): Time recovered per user per week, number of documented workflows, and adoption depth across teams. Companies at this stage recover 2–3 hours per worker per week. That is the correct benchmark. Throughput is not.
- Stage 2 (Operationalizing): Workflow documentation rate, champion retention, and tool-to-workflow ratio. A 1:1 ratio of tools to documented workflows is the target.
- Stage 3 (Scaling): Throughput increases, cost-to-serve reduction, and automated workflow coverage. Stage 3 companies achieve 20–35% productivity gains and 30–50% cycle time reduction.
- Stage 4 (Compounding): Continuous improvement rates rather than absolute output levels. These systems require sophisticated measurement infrastructure to track compounding gains over time.
“Applying Stage 3 ROI expectations to Stage 1 implementations leads to unrealistic benchmarking. Early stages are measured by task time recovery. Later stages are measured by throughput and cost-to-serve. Confusing the two is the most common executive error in AI program management.”
The practical implication is clear. A 20-person team at Stage 1 recovering 3 hours per person per week generates roughly $25,000 per month in saved labor costs. That is real value. It just does not look like a transformation story yet.
2. What are realistic timeframes and investments for AI maturity progression?

Growth-stage executives consistently underestimate how long it takes to move through AI maturity stages. The transition from Exploring to Operationalizing takes 12–18 months for most mid-market firms. That timeline is not a failure. It is the norm.
Investment levels follow a predictable pattern:
- Stage 1 to Stage 2 (months 1–6): Focus on tool selection, initial workflow documentation, and identifying AI champions. Costs are primarily internal time and licensing fees.
- Stage 2 to Stage 3 (months 6–18): Strategy, implementation, and enablement costs for mid-market firms range from €30,000 to €80,000. This covers consulting, training, and workflow architecture.
- Stage 3 to Stage 4 (months 18+): The hardest leap. Progress stalls not because of technical failures but because of sustained executive commitment and workflow documentation gaps. Cross-functional adoption becomes the bottleneck.
- Funding alignment: Budget releases should be tied to maturity milestones, not calendar quarters. Releasing Stage 3 funding before Stage 2 benchmarks are met wastes capital.
Pro Tip: Tie each budget release to a specific maturity milestone, such as “10 documented workflows with named champions,” rather than a time-based trigger. This prevents overspending at early stages and keeps the program accountable.
Staged funding aligned to maturity benchmarks is the most underused governance tool available to growth-stage executives. It forces honest assessment and prevents the common trap of spending at scale before the foundation is ready.
3. What are the top AI productivity drivers and pitfalls for growth-stage executives?
The biggest driver of AI productivity at growth-stage companies is ownership. Named AI champions who maintain workflow documentation and coach their teams produce measurably better outcomes than programs run by a central IT function alone.
The most damaging pitfalls are:
- Stage mismatch in benchmarking: Expecting cost-to-serve reductions at Stage 1 destroys executive confidence in programs that are performing exactly as they should.
- Tool accumulation without workflow documentation: Over-investing in AI tools without corresponding workflow ownership stalls maturity regardless of spend. The tool-to-workflow ratio should stay close to 1:1.
- Prompt engineering as the only optimization lever: True AI performance gains come from multi-axis optimization that includes system prompts, retrieval configuration, and model selection. Focusing only on prompts captures a fraction of available improvement.
- Ignoring cross-functional adoption: AI productivity gains compound when multiple departments adopt shared workflows. Siloed adoption caps returns at the team level. A cross-team adoption strategy is what separates Stage 2 from Stage 3 companies.
Pro Tip: Assign a named AI champion in every department before scaling tool access. Champions who own specific workflows and track weekly time saved create the accountability structure that prevents stagnation.
The common adoption blockers executives face are rarely technical. They are organizational. Workflow ownership and champion retention are the two variables most correlated with healthy maturity progression.
4. How can growth-stage companies use AI productivity benchmarks to optimize their AI investment strategy?
The right AI productivity metrics change as your company matures. Using the wrong ones at the wrong time produces misleading signals and bad decisions.
Early-stage performance indicators (Stage 1–2):
Weekly time saved per user and the number of written, documented workflows are the two most reliable early indicators. A healthy rollout grows from one workflow and two tools at 60 days to 4–6 workflows and tools by nine months, with named champions and tracked output at each step. Adoption growth rate and champion retention rate signal whether the program has organizational traction.
Mid-stage investment signals (Stage 3):
At Stage 3, the benchmark shifts to throughput and cost-to-serve. Growth-stage companies with $5M–$50M ARR report one avoided hire per $5M revenue within an 18-month AI deployment cycle. That metric is a concrete, board-level signal of AI productivity value.
| Metric | Stage 1–2 | Stage 3–4 |
|---|---|---|
| Primary measure | Hours saved per user per week | Throughput increase, cost-to-serve reduction |
| Workflow target | 1–3 documented workflows | 4–6+ cross-functional workflows |
| Tool-to-workflow ratio | 1:1 | 1:1 or better |
| Champion metric | Named champions per team | Champion retention rate |
| ROI signal | Labor cost recovery | Avoided hires, cycle time reduction |
Periodic self-assessment cadence:
Quarterly 90-day self-assessments prevent lost momentum and clarify the path to the next maturity stage. The assessment should answer three questions: How many workflows are documented and actively used? What is the current time-saved-per-user figure? Are champions retained and engaged?
Aligning tool-to-workflow ratios prevents overspending. When tool count outpaces documented workflows, you are paying for capability that no one is using. That ratio is the clearest early warning signal available to a growth-stage executive. Tekkr’s Configurato platform tracks exactly this, breaking down AI tool usage and costs by team so executives can see where adoption is real and where it is not.
Pro Tip: Run a quarterly audit of your tool-to-workflow ratio. If you have more AI tools than documented workflows, pause new tool purchases until documentation catches up.
Key Takeaways
AI productivity benchmarks for growth-stage companies only work when they match the company’s current AI maturity stage, with early stages measured by time recovered and later stages by throughput and cost-to-serve.
| Point | Details |
|---|---|
| Match metrics to maturity | Use time-saved-per-user at Stage 1–2; shift to throughput and cost-to-serve at Stage 3–4. |
| Expect 12–18 months to scale | Moving from Exploring to Operationalizing takes over a year for most mid-market firms. |
| Maintain a 1:1 tool-to-workflow ratio | More tools than documented workflows signals wasted spend and stalled maturity. |
| Name champions before scaling | Named AI champions with workflow ownership are the strongest predictor of healthy adoption. |
| Use quarterly self-assessments | 90-day reviews prevent momentum loss and clarify the next maturity milestone. |
The metric that actually tells you if your AI program is working
Most executives I work with arrive with the same problem. They bought AI tools, saw some early enthusiasm, and now cannot tell whether the program is succeeding or slowly dying. The answer is almost always that they are measuring the wrong thing for their stage.
The uncomfortable truth is that Stage 1 AI programs are supposed to look modest. Three hours saved per person per week is not a failure. It is exactly what the data says to expect. The failure is when executives benchmark that result against Stage 3 expectations and pull funding. That decision kills programs that were six months away from compounding returns.
What I have seen work consistently is a simple shift in framing. Stop asking “What is our AI ROI?” and start asking “What stage are we at, and are we hitting the benchmarks for that stage?” The second question is answerable. The first one, at Stage 1, is a trap.
The other pattern worth naming is the documentation debt problem. Companies that skip workflow documentation in the early stages always hit a ceiling at Stage 2. They have tools, they have some usage, but they cannot scale because no one has written down how the work actually gets done with AI. That documentation gap is the real bottleneck, not the technology.
Executive commitment to the boring work of documentation and champion retention is what separates companies that reach Stage 4 from those that stall. The AI adoption best practices that actually work are not glamorous. They are disciplined.
— TekkrTools
Tekkr helps growth-stage companies prove AI is working
Growth-stage executives need more than a dashboard. They need a system that shows exactly where AI adoption is real, where it is stalled, and what to do next.
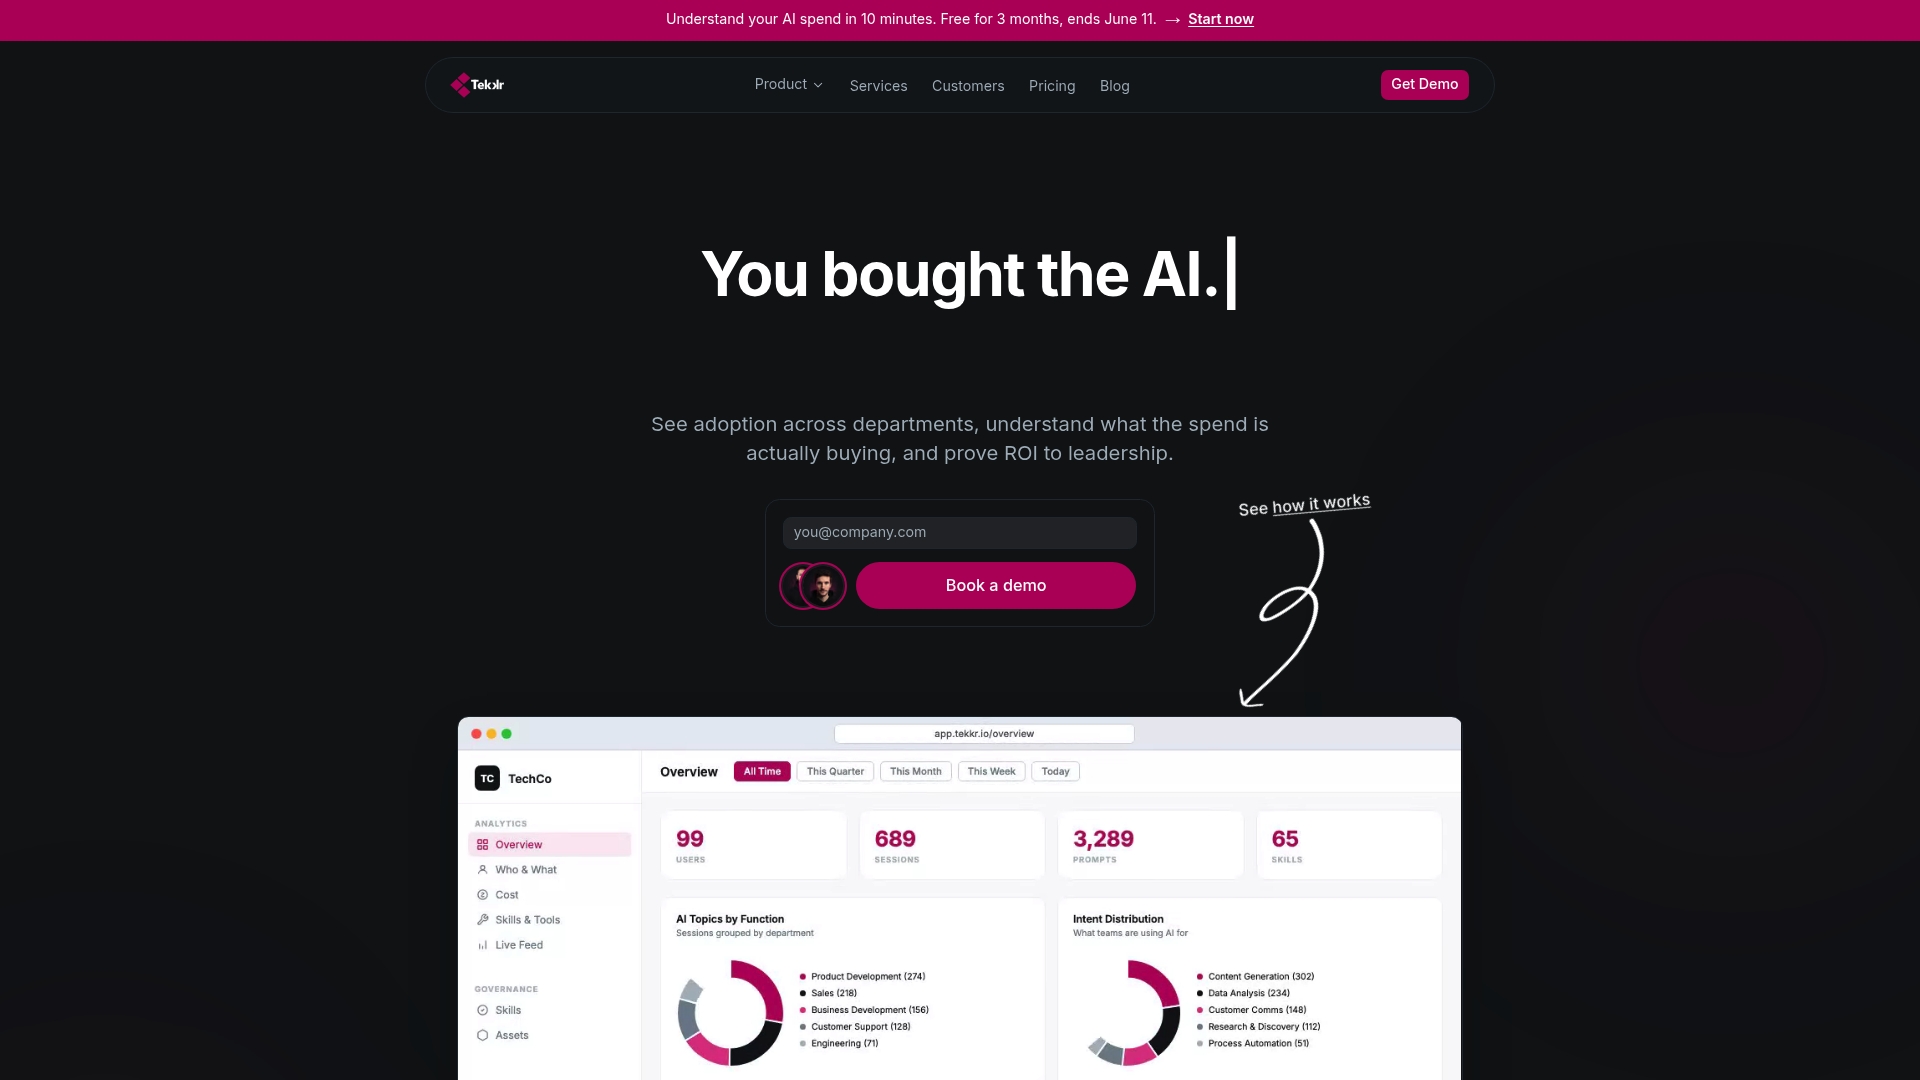
Tekkr’s AI adoption platform, Configurato, tracks AI tool usage, spend, and workflow coverage by team. It surfaces which tools are actually being used, breaks down costs at the department level, and identifies where adoption has stalled before it becomes a budget problem. Gamified rollouts and company-wide AI playbooks drive adoption without requiring IT to manage every step. Setup takes 10 minutes, there is a free tier, and no credit card is required. If you bought the AI, Tekkr helps you prove it is working.
FAQ
What are AI productivity benchmarks for growth-stage companies?
AI productivity benchmarks are stage-specific metrics used to evaluate whether an AI program is delivering expected value. Early stages measure time recovered per user per week; later stages track throughput, cost-to-serve reduction, and avoided hires.
How long does it take to see real AI productivity gains?
Moving from initial AI exploration to measurable operational gains typically takes 12–18 months for mid-market firms. Stage 1 returns appear within weeks as time savings; Stage 3 gains like 20–35% productivity increases require sustained workflow development and champion retention.
What is the biggest mistake executives make when measuring AI performance?
The most common error is applying Stage 3 ROI expectations to Stage 1 implementations. This stage mismatch causes executives to cancel programs that are performing correctly for their maturity level.
How many AI tools should a growth-stage company have?
The tool-to-workflow ratio should stay close to 1:1. Having more tools than documented workflows is a reliable signal of wasted spend and stalled AI maturity, regardless of total investment.
How often should growth-stage companies assess their AI maturity?
Quarterly 90-day self-assessments are the recommended cadence. Regular reviews prevent momentum loss, clarify the path to the next maturity stage, and keep executive focus on the right benchmarks.